Tag Archives: onload

FNDF Has Great Risk Factors And Enough Liquidity, But I Really Dislike The Cash Position

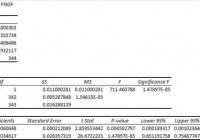
Summary I’m taking a look at FNDF as a candidate for inclusion in my ETF portfolio. The extremely low correlation with other major funds (like SPY) is great and holds up despite a decent time frame and high volume of trades. The expense ratio is a bit high for my liking and is combined with a fairly large position in cash. Investors should treat cash in an ETF as a savings account that charges them an expense ratio instead of paying interest. I’m not assessing any tax impacts. Investors should check their own situation for tax exposure. Investors should be seeking to improve their risk adjusted returns. I’m a big fan of using ETFs to achieve the risk adjusted returns relative to the portfolios that a normal investor can generate for themselves after trading costs. I’m working on building a new portfolio and I’m going to be analyzing several of the ETFs that I am considering for my personal portfolio. One of the funds that I’m considering is the Schwab Fundamental International Large Company Index ETF (NYSEARCA: FNDF ). I’ll be performing a substantial portion of my analysis along the lines of modern portfolio theory, so my goal is to find ways to minimize costs while achieving diversification to reduce my risk level. What does FNDF do? FNDF attempts to track the total return of the Russell Fundamental Developed ex-U.S. Large Company Index. Normally at least 90% of the assets are invested in funds included in this index, but there appears to be some leeway under unusual market conditions. FNDF falls under the category of “Foreign Large Value.” Does FNDF provide diversification benefits to a portfolio? Each investor may hold a different portfolio, but I use the SPDR S&P 500 Trust ETF (NYSEARCA: SPY ) as the basis for my analysis. I believe SPY, or another large cap U.S. fund with similar properties, represents the reasonable first step for many investors designing an ETF portfolio. Therefore, I start my diversification analysis by seeing how it works with SPY. I start with an ANOVA table: (click to enlarge) The correlation is only 82%, which is very solid for modern portfolio theory. Extremely low levels of correlation are wonderful for establishing a more stable portfolio. I consider anything under 50% to be extremely low. However, when I see those values it usually comes with issues, such as low average volume, which can create distorted statistics. For an ETF with around 184,000 shares trading hand each day, the 82% is very impressive. Standard deviation of daily returns (dividend adjusted, measured since August 2013) The standard deviation is pretty good. For FNDF it is 0.8055%. For SPY, it is 0.6891% for the same period. SPY usually beats other ETFs in this regard. If an ETF is only 0.10% to 0.15% over SPY with heavy trading volume it is doing fairly well for stability. Mixing it with SPY I also run comparisons on the standard deviation of daily returns for the portfolio assuming that the portfolio is combined with the S&P 500. For research, I assume daily rebalancing because it dramatically simplifies the math. With a 50/50 weighting in a portfolio holding only SPY and FNDF, the standard deviation of daily returns across the entire portfolio is 0.7135%. With 80% in SPY and 20% in FNDF, the standard deviation of the portfolio would have been 0.6898%. If an investor wanted to use FNDF as a supplement to their portfolio, the standard deviation across the portfolio with 95% in SPY and 5% in FNDF would have been 0.6881%. Why I use standard deviation of daily returns I don’t believe historical returns have predictive power for future returns, but I do believe historical values for standard deviations of returns relative to other ETFs have some predictive power on future risks and correlations. Yield & Taxes The distribution yield is 0.50%. Retirees seeking yields won’t find them here, but the low correlation still looks good for investors that don’t need strong yields. I’m not a CPA or CFP, so I’m not assessing any tax impacts. Expense Ratio The ETF is posting 0.32% for an expense ratio. I want diversification, I want stability, and I don’t want to pay for them. The expense ratio on this fund is higher than I want to pay for equity securities, but not high enough to make me eliminate it from consideration. Market to NAV The ETF is at a 0.85% premium to NAV currently. Premiums or discounts to NAV can change very quickly so investors should check prior to putting in an order. I don’t want to pay a premium over 0.2%, and this premium has persisted despite a respectable amount of daily volume. I don’t see these premiums as sustainable over the long term, so I would be concerned about entering a position without seeing the premium drop first. Largest Holdings The diversification within the ETF is pretty good, so long as we only look at the equity securities. (click to enlarge) I’m not big on the holdings including a 10% value for U.S. dollars. I have nothing against dollars, but I already have them in my checking and savings account. Neither of those accounts are charging me an expense ratio. Conclusion I’m currently screening a large volume of ETFs for my own portfolio. The portfolio I’m building is through Schwab, so I’m able to trade FNDF with no commissions. I have a strong preference for researching ETFs that are free to trade in my account, so most of my research will be on ETFs that fall under the “ETF OneSource” program. For the level of liquidity, the low correlation is great. However, I’m not comfortable investing at a significant premium to NAV and with the high volumes of trades the bid-ask spread may be tight enough that I wouldn’t have a very good shot of triggering a limit buy order at the price I would want to use. Even if I put those issues aside, I’m not big on buying into an ETF with a pile of cash earning an expense ratio. I have quite enough exposure to cash through my bank accounts without having an ETF hold it for me. Additional disclosure: Information in this article represents the opinion of the analyst. All statements are represented as opinions, rather than facts, and should not be construed as advice to buy or sell a security. Ratings of “outperform” and “underperform” reflect the analyst’s estimation of a divergence between the market value for a security and the price that would be appropriate given the potential for risks and returns relative to other securities. The analyst does not know your particular objectives for returns or constraints upon investing. All investors are encouraged to do their own research before making any investment decision. Information is regularly obtained from Yahoo Finance, Google Finance, and SEC Database. If Yahoo, Google, or the SEC database contained faulty or old information it could be incorporated into my analysis. The analyst holds a diversified portfolio including mutual funds or index funds which may include a small long exposure to the stock.
US Value Stocks: Rewriting The Market’s Playbook

Summary The traditional playbook that investors have used to navigate market cycles has become outdated. Certain sectors usually become inexpensive after the type of market run that we’ve experienced during the past few years. But investors are chasing yield, which has kept certain stocks expensive. Invesco’s US Value complex includes three broad strategies, each with a distinct approach to evaluating companies. Looking into 2015, we highlight where each approach is seeing the most attractive opportunities. By Kevin Holt The traditional playbook that investors have used to navigate market cycles has become outdated. Certain sectors usually become inexpensive after the type of market run that we’ve experienced during the past few years. But, because interest rates are so low, investors are chasing yield. That has kept certain stocks expensive when you wouldn’t normally expect them to be, based on past cycles. At the same time, other sectors look attractive when they would normally be out of favor. For example, when you look at market history, value investors would not typically want to own financials at this point in the cycle. However, as we enter 2015, I believe financials have very attractive valuations, along with a surplus of capital that I expect to be returned back to shareholders in the form of increased dividends and/or stock buybacks. Overall, I believe the quality of the financials sector is the best we’ve seen in at least a decade, and see this story playing out over the course of the next four or five years. On the other hand, I believe that broadly, the consumer staples and telecommunications sectors are either fairly valued or expensive, as investors have driven up valuations in their search for yield. However, as bottom-up stock pickers, all of our value managers are focused on finding value opportunities wherever they may be – even within sectors that may be overvalued as a whole. Invesco’s US Value complex includes three broad strategies. There are many ways to be successful and intellectual independence is a core value across our teams. Each strategy has a distinct approach to evaluating companies. Looking into 2015, here is where each approach is seeing the most attractive opportunities: Our relative value strategies look for companies that are inexpensive relative to their own history. In this space, we have a particular interest in energy stocks as we enter the new year. Often, market volatility can lead to value opportunities, as quality companies get swept up in the sell-off. The oil markets experienced significant volatility toward the end of 2014 that may result in such opportunities. Our deep value strategies look for companies that are trading at a discount to their intrinsic value. In this space, our managers are also emphasizing energy stocks as well as financials, for the reasons stated above. Our dividend value strategies closely evaluate companies’ total return profile, emphasizing appreciation, income and preservation over a full market cycle. Through this lens, they are finding stock-specific opportunities within the consumer area. Our dividend managers have a high confidence in the durability of margins and of free cash flow generation for their holdings over the next two to three years, and believe that expectations for top-line recovery embedded in street estimates are conservative. So, while 2015 may feel like a very different year for the markets, our approach is the same as ever – across all three value sleeves, and across large-, mid- and small-cap stocks, we’re looking for opportunities that fit our philosophy, no matter what the typical market playbook says. Important information A value style of investing is subject to the risk that the valuations never improve or that the returns will trail other styles of investing or the overall stock markets. Common stocks do not assure dividend payments. Dividends are paid only when declared by an issuer’s board of directors and the amount of any dividend may vary over time. Stocks of small and mid-sized companies tend to be more vulnerable to adverse developments, may be more volatile, and may be illiquid or restricted as to resale. The information provided is for educational purposes only and does not constitute a recommendation of the suitability of any investment strategy for a particular investor. Invesco does not provide tax advice. The tax information contained herein is general and is not exhaustive by nature. Federal and state tax laws are complex and constantly changing. Investors should always consult their own legal or tax professional for information concerning their individual situation. The opinions expressed are those of the authors, are based on current market conditions and are subject to change without notice. These opinions may differ from those of other Invesco investment professionals. NOT FDIC INSURED MAY LOSE VALUE NO BANK GUARANTEE All data provided by Invesco unless otherwise noted. Invesco Distributors, Inc. is the US distributor for Invesco Ltd.’s retail products and collective trust funds. Invesco Advisers, Inc. and other affiliated investment advisers mentioned provide investment advisory services and do not sell securities. Invesco Unit Investment Trusts are distributed by the sponsor, Invesco Capital Markets, Inc., and broker-dealers including Invesco Distributors, Inc. PowerShares® is a registered trademark of Invesco PowerShares Capital Management LLC (Invesco PowerShares). Each entity is an indirect, wholly owned subsidiary of Invesco Ltd. ©2014 Invesco Ltd. All rights reserved. blog.invesco.us.com

Contango Is Working Against U.S. Oil ETF Investors

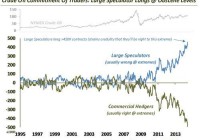
Summary WTI crude oil is in a state of contango, which will cost USO shareholders roughly 17 cents per share this month. The net long position for speculators is still too high. A V-shaped recovery in oil is unlikely. By Ivan Y. WTI and Brent crude oil prices finished 2014 down 46% and 48%, respectively. Besides a surplus in oil, which is expected to be more than 1 million bpd in 2015 for OPEC oil based on current production levels, a rising U.S. Dollar, and negative momentum, there are two other factors that are currently working against investors in The United States Oil ETF, LP (NYSEARCA: USO ). Back to Contango Just a few months ago, WTI oil was in a slight backwardization. This provided a slight benefit to USO shareholders due to the fact that the fund was paying a cheaper price when it rolled over its crude contracts every month. However, WTI oil is currently in a state of contango. Although it is not a big spread, the fund will have to pay a premium when it does its monthly rollovers. Based on Friday’s closing price, the March 2015 contract is 45 cents more expensive than the February 2015 contract. That represents a 0.85% premium and is equivalent to about 17 cents in the share price of USO. If the spread does not change this month, investors should expect USO to deteriorate in value by about 17 cents per share this month. This may not affect short-term traders, but anyone who plans to hold USO for a longer period can consider selling out-of-the-money covered call options to make up for the expected loss. For example, currently, the January (5th week) $23 call is priced at 18 cents on the bid. Selling that call should be sufficient to compensate for the expected contango loss. USO would have to rise by over 15% in order for that call to be in-the-money, so it’s likely to expire worthless. The COT Report Another issue that could put a damper on USO is the fact that speculators, according to the most recent COT report for positions as of December 23, 2014, still have a very high net long position. The so-called speculators (e.g. hedge funds) are not considered to be the smart money in the commodity markets. The report shows that they are net long by 320,337 contracts. That is significantly less than the peak of roughly 450k contracts during last June, but it is still high when compared historically. Prior to 2011, which you can see in the chart below, the net long position had not exceeded 250k contracts, and even 100k during that period was considered to be extremely high. The fact that speculators still have a very high net long position, at least when compared historically, means that there probably needs to be more liquidation before we arrive at a more normalized net long position. Thoughts on Price In hindsight, I was clearly wrong about where the price of oil would bottom. Back in October, I suggested that Brent oil would bottom around $85 (which would’ve been roughly $80 for WTI) because that was Saudi Arabia’s fiscal breakeven point. I completely underestimated the political and competitive risks to that assumption. First, at least in my opinion, one of the primary reasons for oil’s collapse was due to an orchestrated attempt by the U.S. (via Saudi Arabia’s refusal to defend the price) to punish Vladamir Putin for his extra-curricular activities in Ukraine. This is an obvious strategy that works due to the Russian government’s reliance on oil & gas sales for revenue. Second, it is also obvious that Saudi Arabia also wants to curtail the shale oil revolution in the U.S. It seems like every week, some person associated with OPEC will say something that indicates that they will not cut production and will let market forces dictate the price, even if it drops to $20 according to a Saudi oil minister. How many times do they need to keep repeating the same message? That being said, oil has already been pushed down enough to curtail cap-ex spending by many producers. Here are a few examples: Penn West (NYSE: PWE ) cuts 2015 cap-ex by $215 million ConocoPhillips (NYSE: COP ) cuts 2015 cap-ex by 20% Marathon Oil (NYSE: MRO ) cuts 2015 cap-ex by 20% However, low prices probably need to persists for several months at least in order for exploration and production to be cut in the longer-term. It really looks like Saudi Arabia is willing to suffer in the short-term in order to benefit in the long-term. Based on that, a V-shaped rebound in oil is unlikely. Saudi Arabia could, if they wanted to, move the price back up immediately just by making an announcement that they will cut production, but it doesn’t look like they want to do that. I think USO is going to struggle for several more weeks or months.