Tag Archives: onload

Comparing 4 Tactical/Momentum ETFs

Summary Momentum is regarded as the premier anomaly due to its persistent outperformance over long periods of time. With grim clouds presently hanging over today’s stock markets, tactical/momentum ETFs may allow an investor to conduct “passive market timing.”. This article is a brief overview of several recently launched tactical/momentum ETFs. Introduction Momentum is often regarded as the premier anomaly due to its persistent outperformance over long periods of time. Stocks that have done well recently tend to continue to do well, while stocks that have done poorly recently tend to continue to do poorly. The momentum concept is embodied in aphorisms such as “Cut your losers and let your winners run.” Interestingly, momentum often runs counter to the tenets of value investing, which champions buying low and selling high. In a one-to-one contest however, the momentum premium beats the value premium hands down. In data presented in an article by GestaltU, the difference between high momentum (Sharpe = 0.58) and low momentum (0.05) stocks was much greater than the difference between value (0.49) and growth (0.23) stocks in the U.S. The p -value of the Sharpe ratio difference for momentum was

iShares Core S&P Small-Cap ETF: IJR’s 2014 And Fourth-Quarter Performance And Seasonality

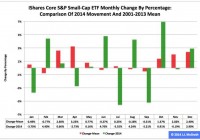
Summary The iShares Core S&P Small-Cap ETF ranked No. 3 in 2014 among the three most popular exchange-traded funds based on the S&P 1500’s constituent indexes. Most recently, the ETF’s adjusted closing daily share price last month ballooned to $114.06 from $110.85, a swelling of $3.21, or 2.90 percent. Seasonality analysis indicates the fund may move to relative weakness in the first quarter from absolute strength in the fourth quarter. The iShares Core S&P Small-Cap ETF (NYSEARCA: IJR ) ranked third by return during 2014 among the three most popular ETFs based on the S&P 1500’s constituent indexes, as it was handily outdistanced by both the SPDR S&P 500 Trust ETF (NYSEARCA: SPY ) and the SPDR S&P MidCap 400 ETF (NYSEARCA: MDY ). Measured by adjusted closing daily share prices, IJR progressed to $114.06 from $107.76, a yield of $6.30, or 5.85 percent. As a result, the small-capitalization ETF lagged the large-cap SPY by -7.62 percentage points and the middle-cap MDY by -3.55 percentage points. However, role reversal in the fourth quarter had IJR leading SPY by 4.90 percentage points and MDY by 3.49 percentage points, as the small-cap ETF soared $10.18, or 9.80 percent. Accounting for its three-to-one share split in 2005, IJR intraday Dec. 31 hit an all-time high of $115.74, a level I consider important because of its proximity to the estimate presented in my “SPY, MDY And IJR At The Fed’s QE3+ Market Top” last March. With the U.S. Federal Reserve actually announcing the end of its latest quantitative-easing program, aka QE3+, Oct. 29 and potentially announcing the beginning of its interest-rate hikes April 29, market participants may be more likely to sell than to buy IJR this quarter. It is worth noting in this context that the Fed’s conclusion of asset purchases under its first two formal QE programs this century is associated with bear markets in small-cap equities , as evidenced by the iShares Russell 2000 ETF (NYSEARCA: IWM ) sliding -21.43 percent in 2010 and -30.78 percent in 2011. Figure 1: IJR Monthly Change, 2014 Vs. 2001-2013 Mean (click to enlarge) Source: This J.J.’s Risky Business chart is based on analyses of adjusted closing monthly share prices at Yahoo Finance . IJR behaved a lot worse in 2014 than it did during its initial 13 full years of existence based on the monthly means calculated by employing data associated with that historical time frame (Figure 1). The same data set shows the average year’s weakest quarter was the third, with a relatively small negative return, and its strongest quarter was the fourth, with an absolutely large positive return. Generally consistent with this pattern, the ETF last year booked a huge loss in Q3 and a huge gain in Q4. Figure 2: IJR Monthly Change, 2014 Vs. 2001-2013 Median (click to enlarge) Source: This J.J.’s Risky Business chart is based on analyses of adjusted closing monthly share prices at Yahoo Finance. IJR performed even more worse in 2014 than it did during its initial 13 full years of existence based on the monthly medians calculated by using data associated with that historical time frame (Figure 2). The same data set shows the average year’s weakest quarter was the third, with a relatively small positive return, and its strongest quarter was the fourth, with an absolutely large positive return. It also shows there is no historical statistical tendency for the ETF to explode in Q1. Meanwhile, the small-cap category of the equity market continues to look grossly overvalued, with the Russell 2000’s price-to-earnings ratio on a trailing 12-month basis calculated as 61.83 Jan. 2, according to Birinyi Associates data published by The Wall Street Journal . Disclaimer: The opinions expressed herein by the author do not constitute an investment recommendation, and they are unsuitable for employment in the making of investment decisions. The opinions expressed herein address only certain aspects of potential investment in any securities and cannot substitute for comprehensive investment analysis. The opinions expressed herein are based on an incomplete set of information, illustrative in nature, and limited in scope. In addition, the opinions expressed herein reflect the author’s best judgment as of the date of publication, and they are subject to change without notice.

Revisiting The ‘Problem’ With Leveraged ETFs

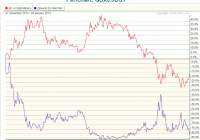
Editor’s note: Originally published at tsi-blog.com on January 6, 2015. My 3rd November blog post explained why leveraged ETFs should only ever be used for short-term trades. To set the scene, here is an excerpt from this earlier post: The crux of the matter is that leveraged ETFs are designed to move by 2 or 3 times the DAILY percentage changes of the target indexes. They are NOT designed to move by 2 or 3 times the percentage change of the target indexes over periods of longer than one day. Due to the effects of compounding, their percentage changes over periods of much longer than one day will usually be less – and sometimes substantially less – than 2-times (in the case of a 2X ETF) or 3-times (in the case of a 3X ETF) the percentage changes in the target indexes. In the earlier post, I presented tables to show that the greater the volatility of an index and the greater the leverage provided by an ETF linked to the index, the worse the likely performance of the leveraged ETF over extended periods. The worse, that is, relative to the performance superficially implied by the daily percentage change relationship between the index and the leveraged ETF. I concluded that leveraged ETFs are only suitable for short-term trades and that a trade should be very short term if it involves a 3X ETF and/or a volatile market. To illustrate how badly a leveraged ETF can perform relative to the performance superficially implied by the daily percentage change relationship between the leveraged ETF and the market to which it is linked, here is a chart comparing the performances of the Market Vectors Junior Gold Miners ETF ( GDXJ) and the Direxion Daily Junior Gold Miners Index Bear 3X Shares ETF ( JDST) since the end of 2013. JDST is designed to have a daily percentage change that is roughly three times the INVERSE of GDXJ’s daily percentage change, so it is an ETF that someone would buy if they were bearish on GDXJ. For example, on a day when GDXJ lost 5%, JDST would gain about 15%, and on a day when GDXJ gained 5%, JDST would lose about 15%. Given that GDXJ is presently about 15% lower than it was at the end of 2013, people who are unfamiliar with how leveraged ETFs work would likely jump to the conclusion that a JDST position purchased at the end of 2013 and held through to the present would show a healthy profit. However, this conclusion could not be further from the truth, because JDST has lost 81% of its value over the period in question. The dismal performance of JDST is a trap for the novice trader, but it is not a design flaw. As outlined in my 3rd November post, it is a mathematical function of how the leverage works and simply means that this type of ETF should only ever be used in trades with time frames of no more than a few weeks. Now that you’ve read this, are you Bullish or Bearish on ? Bullish Bearish Sentiment on ( ) Thanks for sharing your thoughts. Why are you ? Submit & View Results Skip to results » Share this article with a colleague