Tag Archives: onload

SEC Enhancing Regulatory Monitoring Of Asset Managers

by Ron D’Vari The asset management industry is evolving rapidly and so are the regulatory environment and tools that govern and support it. The larger managers had thought they had received a reprieve by the Financial Stability Oversight Council’s decision not to designate individual asset management firms as Systemically Important Financial Institutions (SIFIs), but instead focusing its attention on potential risks within asset managers’ activities and products they offer. As a result, the giant asset managers are spared from Federal Reserve. In an apparent response to that, the SEC is increasing focus on the asset management industry. In a speech on December 11, SEC Chair Mary Jo White referenced new initiatives to address portfolio composition risks and operational risks of asset managers. Portfolio composition risks include liquidity and leverage risks of a fund’s holdings and operational risks encompassing inadequate or failed internal processes and systems. The heightened SEC monitoring will include expanded data reporting and enhanced controls on risks related to portfolio composition and liquidity management. A more comprehensive approach will be taken to monitor the risks associated with the increasingly complex nature of fund holdings and the use of derivatives. Additionally, the SEC will be looking into “transition planning” and stress testing, both market and operationally. Asset managers will be expected to safeguard against the impact on investors of a market stress event or when an investment adviser is no longer able to serve its clients. There has been a significant increase in the use of derivatives by funds in general. More and more, fund managers are using derivatives to adjust or obtain exposure to a market sector more efficiently. However, the risks of implied leveraged exposures and potential illiquidity in derivative instruments can be opaque or underestimated. As a result, management of liquidity and redemption and the use of derivatives in widely distributed mutual funds, ETFs and separately managed accounts are becoming key areas of focus by the SEC. The SEC staff will be watching for significant risks of inadequate controls in those areas, to the funds and their investors, as well as potential impact on the overall financial system. Asset managers will be required to manage risks of not being able to meet redemptions under stressful market scenarios. This means that not only the giant managers have to meet enhanced composition and liquidity regulatory requirements; the entire asset management industry needs to. Now that you’ve read this, are you Bullish or Bearish on ? Bullish Bearish Sentiment on ( ) Thanks for sharing your thoughts. Why are you ? Submit & View Results Skip to results » Share this article with a colleague
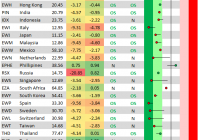
Most Countries Still Oversold

The action in global stocks over the last few days has left 25 of the 30 largest country ETFs in oversold territory. Below is our trading range screen highlighting the trend. For each ETF in the screen below, the black vertical “N” line represents its 50-day moving average. Moves into the red zone are considered “overbought”, while moves into the green zone are considered “oversold”. Throughout this bull market, oversold levels have generally offered up good buying opportunities, but there’s always the risk that the “buy the dip” trade will finally fail to pan out. The only country ETF on the list that is currently in overbought territory is FXI (China). Two others – Phillipines (NYSEARCA: EPHE ) and Turkey (NYSEARCA: TUR ) – are above their 50-day moving averages, while South Africa (NYSEARCA: EZA ) and the US (NYSEARCA: SPY ) are below their 50-days but not oversold. Some of the most oversold countries at the moment include France (NYSEARCA: EWQ ), Italy (NYSEARCA: EWI ), Spain (NYSEARCA: EWP ), Sweden (NYSEARCA: EWD ), Switzerland (NYSEARCA: EWL ) and the UK (NYSEARCA: EWU ) – all Euro-area markets. Just a few countries are in the green for the year, while most are down in the 1-3% range. Some of the country ETFs that have already seen 4%+ declines in 2015 include Canada (NYSEARCA: EWC ), Italy ( EWI ), Malaysia (NYSEARCA: EWM ), France ( EWQ ) and Colombia (NYSEARCA: GXG ). While the Russian ETF (NYSEARCA: RSX ) is still 20% below its 50-day, it’s actually one of the few countries that’s up on the year. Now that you’ve read this, are you Bullish or Bearish on ? Bullish Bearish Sentiment on ( ) Thanks for sharing your thoughts. Why are you ? Submit & View Results Skip to results » Share this article with a colleague

How Are Housing ETFs Poised For The New Year?

The housing construction market has recovered at a steady and gradual pace in the second half of 2014 after a slump at the beginning of the year. Overall economic growth, improving job numbers, growing consumer confidence, moderating home prices, stabilizing mortgage rates and a low level of housing inventory all led to the improvement. A string of housing data released lately portrays a mixed to slightly positive picture of the housing market. Existing home sales and new home sales rose in the month of October. Though housing starts declined in October and November, analysts in general believe the broader housing trends are stable to slightly positive and will pick up momentum in the New Year. Homebuilders are also turning more optimistic as demand for new homes rises with an improving job market and growing consumer confidence. Homebuilders’ confidence, as indicated by the National Association of Home Builders (NAHB)/Wells Fargo housing market index, rose 4 points to 58 in November. Though the index declined a point to 57 in December, it is still well above 50, which is the demarcating line between expanding and contracting activity levels. However, what keeps us concerned are the chances of a rise in short-term interest rates in 2015 as the Fed has already ended its six-year long quantitative easing program in October. Though the Fed had earlier promised to keep the key interest rate at record low for a ‘considerable time,’ investors are speculating about the timing of the planned rate hike. The robust job numbers might draw the Federal Reserve closer to raising interest rates. Higher interest/mortgage interest rates may have a moderating effect on housing demand and pricing. ETFs to Tap the Sector Given the improving fundamentals, the homebuilding sector deserves a closer look. For investors willing to play the space in a less risky way, an ETF approach can be a good idea. This technique can help to spread out assets among a wide variety of companies and reduce company specific risk at a very low cost. Below, we have highlighted three ETFs that are worth looking into. The SPDR Homebuilders ETF (NYSEARCA: XHB ) XHB is one of the more popular homebuilding ETFs in the market today with assets under management of around $1.48 billion and a trading volume of roughly 4.07 million shares a day. The fund has an expense ratio of 35 basis points. The fund holds 37 stocks in its basket, with 44% of the assets going to mid caps and 6% comprising large cap stocks. Despite the smaller holding pattern, the fund does not appear to be concentrated in the top 10 holdings. The fund has just 34.1% in the top 10 with Lowe’s Companies (NYSE: LOW ), Whirlpool Corporation (NYSE: WHR ) and Restoration Hardware Holdings (NYSE: RH ) occupying the top 3 positions with asset allocation of 3.64%, 3.63% and 3.56%, respectively. The fund’s assets include 33% homebuilders, 15% household appliances securities, 26% specialty retail stocks and the balance 26% building materials companies. The fund carries a Zacks Rank #3 (Hold) with a high level of risk. The iShares U.S. Home Construction ETF (NYSEARCA: ITB ) Another popular choice in the homebuilding sector is ITB, which tracks the Dow Jones U.S. Select Home Construction Index. It has $1.55 billion in assets with a trading volume of roughly 3.5 million shares a day, while its expense ratio is just 45 basis points. The fund holds 39 stocks in its basket, out of which only 12% are large cap securities. The fund has a concentrated approach in the top 10 holdings with 62.9% of the asset base invested in them. Among individual holdings, top stocks in the ETF include D.R. Horton, Inc. (NYSE: DHI ), Lennar (NYSE: LEN ) and Pulte (NYSE: PHM ) with asset allocation of 10.97%, 10.53% and 9.67%, respectively. Homebuilders accounts for around 64% of this fund. The fund carries a Zacks Rank #3 (Hold) with a high level of risk. The PowerShares Dynamic Building & Construction Portfolio ETF (NYSEARCA: PKB ) This ETF comprises around 30 housing companies and has its assets invested across all classes of the market spectrum. Engineering and construction stocks comprise 21% of the fund, followed by building materials companies that account for 17%. A look at the style pattern reveals that the fund has a preference for value stocks. The fund manages an asset base of $58.0 million and has an expense ratio of 63 basis points. The fund has only 16% in large cap securities and 46.1% in the top 10 holdings. The fund carries a Zacks Rank #3 (Hold) with a High level of risk. To Sum Up The housing market has improved dramatically from the trough year of 2009. Homebuilding activity is expected to take a cue from improving job numbers and a rebounding economy. Though the timing of a rise in interest rates creates uncertainty, homebuilders are increasingly optimistic of a pick up in sales in the New Year.