Tag Archives: onload

PowerShares QQQ’s 2014 And Fourth-Quarter Performance And Seasonality

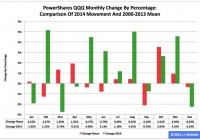
Summary PowerShares QQQ behaved better in 2014 than the three most popular exchange-traded funds based on the S&P 1500’s constituent indexes. However, the derivative of the Nasdaq-100 Index dominated by information technology was not a leader, but a laggard in the fourth quarter. Neither major central bank policies nor related moves in the euro and U.S. dollar currency pair appear likely to help the fund’s performance in the first quarter. The PowerShares QQQ Trust ETF (NASDAQ: QQQ ) had a supercharged 2014, as the ETF skyrocketed to $103.25 from $86.63, a soaring of $16.62, or 19.19 percent, on an adjusted closing daily share price basis. During the year, it outdistanced the SPDR S&P 500 ETF (NYSEARCA: SPY ) by 5.72 percentage points, the SPDR S&P MidCap 400 Trust ETF (NYSEARCA: MDY ) by 9.79 points and the iShares Core S&P Small-Cap ETF (NYSEARCA: IJR ) by 13.34 points. Over the fourth quarter, however, QQQ lost momentum on a relative basis, as it lagged IJR and MDY by -4.89 and -1.40 percentage points, in that order, and led SPY by a measly 0.01 point. Consistent with its seasonal tendency, QQQ capped a very good 2014 with a very bad December, as it was outpaced by IJR, MDY and SPY by -5.14, -3.08 and -1.99 percentage points, respectively. Figure 1: QQQ Monthly Change, 2014 Vs. 2000-2013 Mean (click to enlarge) Source: This J.J.’s Risky Business chart is based on analyses of adjusted closing monthly share prices at Yahoo Finance . QQQ behaved a lot better in 2014 than it did during its initial 14 full years of existence based on the monthly means calculated by employing data associated with that historical time frame (Figure 1). The same data set shows the average year’s weakest quarter was the third, with a relatively large negative return, and its strongest quarter was the fourth, with an absolutely large positive return. Inconsistent with this pattern, the ETF last year made its biggest advances in Q2 and Q3, in that order. Figure 2: QQQ Monthly Change, 2014 Vs. 2000-2013 Median (click to enlarge) Source: This J.J.’s Risky Business chart is based on analyses of adjusted closing monthly share prices at Yahoo Finance. QQQ also behaved a lot better in 2014 than it did during its initial 14 full years of existence based on the monthly medians calculated by using data associated with that historical time frame (Figure 2). The same data set shows the average year’s weakest quarter was the first, with a relatively small positive return, and its strongest quarter was the fourth, with an absolutely large positive return. Clearly, this means there is no historical statistical tendency for the ETF to explode in Q1. Figure 3: PowerShares QQQ Top 10 Holdings, Jan. 6 (click to enlarge) Note: The QQQ holding-weight-by-percentage scale is on the left (green), and the company price/earnings-to-growth ratio scale is on the right (red). Source: This J.J.’s Risky Business chart is based on data at Invesco’s PowerShares QQQ microsite and Yahoo Finance (both current as of Jan. 6). I anticipate one of the biggest headwinds buffeting the large-capitalization QQQ in the first quarter of this year may be the bias divergence in monetary policy at major central banks around the world. On the one hand, the U.S. Federal Reserve is oriented toward tightening; on the other hand, the Bank of Japan, European Central Bank and People’s Bank of China are oriented toward loosening. This divergence has had important effects on exchange rates, such as in the euro and U.S. dollar currency pair, or EUR/USD. It is worth mentioning in this context that the Fed announced the end of asset purchases under its latest quantitative easing program, aka QE3+, Oct. 29, and may announce the beginning of interest rate hikes April 29. Its conclusion of purchases under its first two formal QE programs this century is associated with both a correction and a bear market in large cap equities, as evidenced by SPY’s slipping -17.19 percent in 2010 and sliding -21.69 percent in 2011. The bias divergence at the major central banks has been reflected by action in the EUR/USD cross, which dipped from as high as $1.3992 May 8 to as low as $1.1880 Jan. 5, a drop of -$0.2112, or -15.09 percent, based on data at StockCharts.com . This change in EUR/USD and similar moves in other currency pairs indicate a strengthening greenback and a weakening everything else that could pressure earnings of U.S. companies in sectors with substantial international businesses. Clearly, many technology companies fit this description. In terms of exposure to the tech sector, Invesco reported QQQ’s is 58.07 percent at this time. Meanwhile, valuation may become increasingly important to stock market participants in the short to intermediate terms, especially given the synchronized slowdowns in national (and supranational) economies around the world. Except for Gilead Sciences Inc. (NASDAQ: GILD ), QQQ’s top 10 holdings appear to range from fairly valued to overvalued to absurdly valued (Figure 3). And these kinds of valuations seem unlikely to function as tailwinds for the ETF this quarter. Disclaimer: The opinions expressed herein by the author do not constitute an investment recommendation, and they are unsuitable for employment in the making of investment decisions. The opinions expressed herein address only certain aspects of potential investment in any securities and cannot substitute for comprehensive investment analysis. The opinions expressed herein are based on an incomplete set of information, illustrative in nature, and limited in scope. In addition, the opinions expressed herein reflect the author’s best judgment as of the date of publication, and they are subject to change without notice.
Where Is The Market Going? Separating The Signal From The Noise

No one “knows” where the market will close tomorrow, let alone this year. That doesn’t stop gurus, seers, and writers from telling us which indicators will give us that inside edge. Read enough of them — or even two — and you realize you’re right back where you started. Instead, just concentrate on these important questions for your portfolio strategy. Journalists have to write x number of stories every week to fulfill their contracts. That doesn’t mean you have to read them and, if you still find amusement in so doing, it doesn’t mean you have to act on their advice. Thank heavens. Case in point. At 6:56 p.m. EST on January 6th, Mark Hulbert posted this piece on Marketwatch.com: “Opinion: A bear market in stocks just became more likely .” The gist of the article was summed up neatly in his first two sentences: “Bad news, investors: The Dow Industrials’ 300-plus-point drop Monday markedly increases the likelihood that the bull market has neared its end – if it hasn’t already. That’s because the stock market’s performance in the first two trading days of January has a surprisingly good record of forecasting the direction for the next 12 months.” Mr. Hulbert goes on to describe his pleasure at discovering this new tool, which is even better, he believes, than using the first five days of January as a tool to decide whether to consider investing for the year, and to note that the 1.8% decline in the first two trading days of 2015 were “even bigger than the 1.6% decline the Dow posted over the first two days of 2008, a fateful year that would later experience the worst bear market since the 1930s.” Give’s one pause, doesn’t it? Ah, but hot on the trail of this article comes one the very next day from Reuters titled, ” Here’s What Happened Those Other Times The S&P 500 Started the Year With 3 Down Days. ” The distinction is important, you see – this “indicator” uses the first three days of the new year, not merely the first two. Reuters’ Myles Udland reports on an e-mail sent by Jonathan Krinsky of MKM Partners that says, “During the eight years since 1928 that the S&P started with three-day losing streaks the index has returned 8.36% on average,” better than all years for the S&P since 1928. Well, there you have it. Since Mr. Hulbert’s data goes back to 1896 and Mr. Krinsky’s only until 1928, we are forced to draw one of two conclusions: There were a preponderance of less-than-pleasant market years prior to 1928 that began with 2 down days the first two trading days of the year, or It just doesn’t matter. I am firmly in the latter camp, call it the “Who Cares?” camp. What actionable offensive might an investor take armed with this information? I suppose if one were schizophrenic enough, they could have gone to cash after the second day and rushed back in the fourth day (after the “first 3 days” had passed.) But, really now, who makes their lifetime investing decisions like this? (I know, I know; more than I’d care to imagine.) Forget the First 2 Days / First 3 Days / First 5 Days Indicators and ask yourself this: Does the macro-economic and geopolitical environment favor the geographic and political regions in which you are investing? Are the sectors you favor undervalued or, if you anticipate superb results based on the first question, are they at least currently fairly valued? Do you currently have the appropriate mix of asset classes and individual funds, bonds and stocks to benefit from (or defend against) the market the first two questions lead you to invest in? Then, as the famous investment guru Aaron Rodgers recently said, “R-E-L-A-X.” Invest rationally. Read fewer articles written breathlessly about tea leaves, bones in a circle, or statistical correlation. There may be more kittens born in January than other months, too. Does that mean we should faithfully track the number of kittens born this month? Of course not; correlation does not mean causation. Sometimes it doesn’t mean anything at all… ________ As Registered Investment Advisors, we believe it is our responsibility to advise that we do not know your personal financial situation, so the information contained in this communiqué represents the opinions of the staff of Stanford Wealth Management, and should not be construed as personalized investment advice. Past performance is no guarantee of future results, rather an obvious statement but clearly too often unheeded judging by the number of investors who buy the current #1 mutual fund one year only to watch it plummet the following year. We encourage you to do your own due diligence on issues we discuss to see if they might be of value in your own investing. We take our responsibility to offer intelligent commentary seriously, but it should not be assumed that investing in any securities we are investing in will always be profitable. We do our best to get it right, and we “eat our own cooking,” but we could be wrong, hence our full disclosure as to whether we own or are buying the investments we write about.

Cyber Warfare Risk: What Are The Investment Impacts?

by Ron D’Vari The devastating cyber-attack against Sony and its allegedly state-sponsored origins raises several key questions with respect to the security risk for the global financial system. For example: Should investors be worried about advanced threats on the global financial system by cyber terrorists and/or state-sponsored adversaries to destabilize the global economy and markets? Could there be attacks on the Federal Reserve, the U.S. Treasury or one or more mega banks of a magnitude that would destabilize the U.S. dollar and prompt a global stock market collapse? Do U.S. monetary and fiscal policies render this type of cyber threat potentially more devastating? In what ways could the cyber-threat to the financial system affect the relative attractiveness of “real assets” (real estate, physical commodities, infrastructure investments, etc.) vs. “financial assets” (enterprise value-related assets)? U.S. intelligence agencies as well as major companies are gradually waking up to the critical nature of cyber security to systemic financial stability. Indeed, the financial services industry has already recognized it can no longer work in isolation, marked by the formation of a member-owned non-profit entity, the Financial Services Information Sharing & Analysis Center (FS-ISAC), to provide resources for cyber and physical threat intelligence analysis and to share information about hackings. The U.S. government has not yet developed a unified approach to help companies coordinate a response to an attack and share information. Complications and lack of coordination in the Sony case made that obvious. As a result, the government is expected to sharpen its focus on this. Companies and government agencies will be investing large sums of money in innovative encryption and firewall solutions to make data, Internet and payment systems safer. Cyber war games have already been created as a way to test a company’s response to cyber incidents. The net effect will be positive for investments in the cyber security industry, but may also lower the overall profitability and productivity of the economy in aggregate. Financial advisers have already been warming to real assets as stock market volatility has picked up and demand for a long stream of cash flows by pension funds has increased. With increasing incidents of cyber-attacks, the trend is expected to continue. There will naturally be a slew of litigations in high-profile data breaches and operation interruptions. These will include claims by employees, customers, suppliers and shareholders. Shareholders can sue if a breach affects share values and future financial streams. Now that you’ve read this, are you Bullish or Bearish on ? Bullish Bearish Sentiment on ( ) Thanks for sharing your thoughts. Why are you ? Submit & View Results Skip to results » Share this article with a colleague