Tag Archives: onload

IDLV Deserves Consideration – The Low Correlation To SPY Is Beautiful

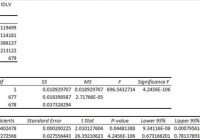
Summary I’m taking a look at IDLV as a candidate for inclusion in my ETF portfolio. The expense ratio is a little high relative to my cheap tastes, but certainly within reason. The correlation to SPY is low and based on reasonable trade volumes. Returns since inception have been fairly weak, but the measuring period is less than 3 years. The ETF might fit for my portfolio. I’m not assessing any tax impacts. Investors should check their own situation for tax exposure. Investors should be seeking to improve their risk adjusted returns. I’m a big fan of using ETFs to achieve the risk adjusted returns relative to the portfolios that a normal investor can generate for themselves after trading costs. I’m working on building a new portfolio and I’m going to be analyzing several of the ETFs that I am considering for my personal portfolio. One of the funds that I’m considering is the PowerShares S&P International Developed Low Volatility Portfolio (NYSEARCA: IDLV ). I’ll be performing a substantial portion of my analysis along the lines of modern portfolio theory, so my goal is to find ways to minimize costs while achieving diversification to reduce my risk level. What does IDLV do? IDLV attempts to track the total return (before fees and expenses) of the S&P BMI International Developed Low Volatility Index. At least 90% of the assets are invested in funds included in this index. IDLV falls under the category of “Foreign Large Blend”. Does IDLV provide diversification benefits to a portfolio? Each investor may hold a different portfolio, but I use (NYSEARCA: SPY ) as the basis for my analysis. I believe SPY, or another large cap U.S. fund with similar properties, represents the reasonable first step for many investors designing an ETF portfolio. Therefore, I start my diversification analysis by seeing how it works with SPY. I start with an ANOVA table: (click to enlarge) The correlation is excellent at 71%. I want to see low correlations on my international investments. Extremely low levels of correlation are wonderful for establishing a more stable portfolio. I consider anything under 50% to be extremely low. However, for equity securities an extremely low correlation is frequently only found when there are substantial issues with trading volumes that may distort the statistics. Standard deviation of daily returns (dividend adjusted, measured since April 2012) The standard deviation is great. For IDLV it is .7265%. For SPY, it is 0.7420% for the same period. SPY usually beats other ETFs in this regard, so a lower volatility level is very impressive. Because the ETF has fairly low correlation for equity investments and a low standard deviation of returns, it should do fairly well under modern portfolio theory. Liquidity looks fine Average trading volume isn’t very high, a bit over 50,000, but that also isn’t low enough to be a major concern for me. Mixing it with SPY I also run comparisons on the standard deviation of daily returns for the portfolio assuming that the portfolio is combined with the S&P 500. For research, I assume daily rebalancing because it dramatically simplifies the math. With a 50/50 weighting in a portfolio holding only SPY and IDLV, the standard deviation of daily returns across the entire portfolio is 0.6794%. With 80% in SPY and 20% in IDLV, the standard deviation of the portfolio would have been .7045%. If an investor wanted to use IDLV as a supplement to their portfolio, the standard deviation across the portfolio with 95% in SPY and 5% in IDLV would have been .7312%. Why I use standard deviation of daily returns I don’t believe historical returns have predictive power for future returns, but I do believe historical values for standard deviations of returns relative to other ETFs have some predictive power on future risks and correlations. Yield & Taxes The distribution yield is 3.17%. That appears to be a respectable yield. This ETF could be worth considering for retiring investors. I like to see strong yields for retiring portfolios because I don’t want to touch the principal. By investing in ETFs I’m removing some of the human emotions, such as panic. Higher yields imply lower growth rates (without reinvestment) over the long term, but that is an acceptable trade off in my opinion. I’m not a CPA or CFP, so I’m not assessing any tax impacts. Expense Ratio The ETF is posting .35% for a gross expense ratio, and .25% for a net expense ratio. I want diversification, I want stability, and I don’t want to pay for them. The expense ratio on this fund is slightly higher than I want to pay for equity securities, but not high enough to make me eliminate it from consideration. I view expense ratios as a very important part of the long term return picture because I want to hold the ETF for a time period measured in decades. Market to NAV The ETF is at a .23% premium to NAV currently. Premiums or discounts to NAV can change very quickly so investors should check prior to putting in an order. The ETF is large enough and liquid enough that I would expect the ETF to stay fairly close to NAV. Generally, I don’t trust deviations from NAV and I will have a strong resistance to paying a premium to NAV to enter into a position. Largest Holdings The diversification is very good in this ETF. My favorite thing about the ETF is easily the diversification. If I’m going to be stuck with that expense ratio, I expect it to buy a fairly strong level of diversification and in this case it appears to do just that. (click to enlarge) Conclusion I’m currently screening a large volume of ETFs for my own portfolio. The portfolio I’m building is through Schwab, so I’m able to trade IDLV with no commissions. I have a strong preference for researching ETFs that are free to trade in my account, so most of my research will be on ETFs that fall under the “ETF OneSource” program. I like the correlation and the diversification in the holdings. Overall, the fund is looking pretty good. While I’m fairly cheap in regards to expense ratios, this one isn’t too bad. A few years ago I would have treated it as being very favorable, but I’m getting spoiled by seeing the ETFs with gross expense ratios under .10. I don’t place a large importance on historical returns (outside of risk), but the fund did underperform SPY by a fairly large amount over the holding period I used. The dividend adjusted close for SPY moved up by 49.11% and for IDLV it moved up 19.9%. I’m going to keep IDLV in my list of potential ETFs for international exposure, but if it makes the final round of challengers I’ll need to dig into the securities and make sure they are capable of producing higher levels of returns. Since it is an international equity fund, I’d be looking at a 5% to 10% allocation if it is selected. The author has no positions in any stocks mentioned, and no plans to initiate any positions within the next 72 hours. The author wrote this article themselves, and it expresses their own opinions. The author is not receiving compensation for it (other than from Seeking Alpha). The author has no business relationship with any company whose stock is mentioned in this article. Additional disclosure: Information in this article represents the opinion of the analyst. All statements are represented as opinions, rather than facts, and should not be construed as advice to buy or sell a security. Ratings of “outperform” and “underperform” reflect the analyst’s estimation of a divergence between the market value for a security and the price that would be appropriate given the potential for risks and returns relative to other securities. The analyst does not know your particular objectives for returns or constraints upon investing. All investors are encouraged to do their own research before making any investment decision. Information is regularly obtained from Yahoo Finance, Google Finance, and SEC Database. If Yahoo, Google, or the SEC database contained faulty or old information it could be incorporated into my analysis. The analyst holds a diversified portfolio including mutual funds or index funds which may include a small long exposure to the stock.
How Long Before ‘They’re Raising Rates’ To ‘They’re Considering QE4?’

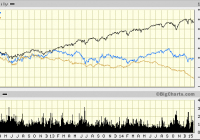
If foreign economic stagnation and commodity price depreciation is an old story, then why are U.S. equities suddenly responding as though the U.S. economy might be in danger? The daily volatility over the last 10 weeks is primarily attributable to the Federal Reserve terminating its third iteration of “QE” back in October. The central banks of the world have been remarkably successful at repressing the risk of equity market participation. The media are telling us that U.S. stocks have been under pressure this January due to global growth fears and an accompanying rout across the entire commodity space. Yet that only tells a small part of the story. After all, the S&P 500 SPDR Trust ETF (NYSEARCA: SPY ) has performed quite admirably over the past three years, blissfully unresponsive to the global growth woes reflected in ETFs like the Vanguard FTSE Emerging Markets ETF (NYSEARCA: VWO ) and the iPath Dow Jones-UBS Commodity Index Total Return ETN (NYSEARCA: DJP ). If foreign economic stagnation and commodity price depreciation is an old story, then why are U.S. equities suddenly responding as though the U.S. economy might be in danger? Where’s the enthusiasm for the enormous stimulus associated with cheap oil and gas? What happened to the euphoria over the best job growth since 1999? In truth, the daily volatility over the last 10 weeks is primarily attributable to the Federal Reserve terminating its third iteration of “QE” back in October – an electronic money creating, bond-buying program that resulted in the Fed acquiring trillions in U.S. debt. Consider the reality that when the Fed removed a large portion of the supply of treasuries, investors who would have bought those treasuries had to buy assets like corporate bonds instead. This reduced the borrowing costs for corporations and allowed many of them to refinance debts as well as buy back shares of their own stock. Up went the stock market. Similarly, the Fed removed a large portion of the supply of mortgage-backed securities, ultimately lowering the mortgage costs for real estate. Up went the housing market. An increase in the net worth of corporations, small businesses as well as wealthier families did create an atmosphere for greater economic confidence. However, with the Federal Reserve hinting that overnight lending rates might go up as soon as April, butterflies flapping their wings in Rio de Janeiro and Beijing have been creating tremors for U.S. equities. In essence, the stock market is not so sure that our “booming” domestic economy is a self-sustaining wonderland in the absence of central bank stimulus. Nowhere is this more obvious than in the relatively tranquil progress of the FTSE Custom Multi-Asset Stock Hedge Index. In the ten weeks since QE ended (through Jan 14), the index has quietly gained 2.5% while the S&P 500 has fluctuated wildly on its way to being flat. (Note: These results do not yet account for Wednesday’s stock declines.) While the bullish media typically ignore the bulk of what happens with non-equity asset classes, there are specific currencies, commodities and country debt that have historically performed well in moderate-to-severe stock downturns. Asset types like longer-term treasuries, zero-coupon bonds, munis, German bunds, gold, the franc, the yen, the dollar and others fit the bill. The index, often referred to by others as the “MASH Index,” does not short or use leverage like a bear fund; safer haven holdings (ex stocks) often perform better than cash in stock uptrends as well. You can learn more about the FTSE Custom Multi-Asset Stock Hedge Index at StockHedgeIndex.com . Those investors who remain in the bullish camp theorize that the U.S. economy is strong enough to handle modest rate increases. They also anticipate the inevitability of quantitative easing or similar asset-back purchasing measures in the euro-zone as well as China acting to bolster its economic output through a variety of techniques; stock bulls view the troubles overseas as noise and vow to continue buying dips on weakness. In contrast, bears counter with the fact that U.S. stocks are not only at the high end of historical valuations, they may be at the highest levels in recorded history. For instance, Jim Paulsen at Wells Capital explained that U.S. stocks have never been this expensive ever, at least not when one employs the median price-to-earnings ratio. (And Paulsen has been a fixture in the bull camp!) My view? I am neither bullish nor bearish in practice. That said, I am a proponent of applying insurance principles to the investing process. Stop-limit loss orders , trendlines, put options, multi-asset stock hedging – they all minimize the risk of catastrophic loss. Indeed, the reason I partnered with the world’s largest index provider (FTSE-Russell) in developing the FTSE Custom Multi-Asset Stock Hedge Index was to offer a new way to reduce the risks associated with stock market euphoria. The central banks of the world have been remarkably successful at repressing the risk of equity market participation. Throughout the six years of the 2009-2015 bull, whenever there has been a belch (or even a hiccup), the Federal Reserve has come to the rescue with more bond-buying stimulus. On the flip side, if they stick to their guns on raising rates this time, you can expect the uncertainty to fuel even more desire for perceived safe havens. You might look at the iShares 10-20 Year Treasury Bond ETF (NYSEARCA: TLH ) as well as carry trade reversal beneficiaries like the CurrencyShares Japanese Yen Trust ETF (NYSEARCA: FXY ). If the conversation shifts towards “no rate increases until 2016″ or even “a bit more QE is a possibility,” then the unbridled excitement for stock ownership would pump new life into the aging bull. Disclosure: Gary Gordon, MS, CFP is the president of Pacific Park Financial, Inc., a Registered Investment Adviser with the SEC. Gary Gordon, Pacific Park Financial, Inc, and/or its clients may hold positions in the ETFs, mutual funds, and/or any investment asset mentioned above. The commentary does not constitute individualized investment advice. The opinions offered herein are not personalized recommendations to buy, sell or hold securities. At times, issuers of exchange-traded products compensate Pacific Park Financial, Inc. or its subsidiaries for advertising at the ETF Expert web site. ETF Expert content is created independently of any advertising relationships.

Cohen & Steers REIT And Preferred Income Fund: Not Just A Real Estate Offering

Summary RNP is managed by REIT specialist Cohen & Steers. RNP does not, however, have a strict real estate focus. It might be better to look at RNP as a balanced fund of sorts. Cohen & Steers REIT and Preferred Income Fund (NYSE: RNP ) is an interesting animal that tries to combine in one fund two different investment focuses. For investors seeking simplicity, this could be a good option. For those who want more control over their portfolios, you’d be better off buying a real estate investment trust (REIT) fund and a preferred fund separately. Who is Cohen & Steers? I always include a comment about this company’s origin when I write about it because Cohen & Steers isn’t a household name in finance. But it is one if you are remotely connected to the REIT space. That’s because Martin Cohen and Robert Steers were among the first to create a company dedicated to investing in REITs. They basically helped popularize the space for institutional and individual investors. And, more important, the company they created has lots of experience. If you are thinking about outsourcing your REIT investments to anyone, Cohen & Steers should be on your short list. So, from that standpoint, I like anything they do that involves real estate investing. Only half the fund But that’s only half of what Cohen & Steers REIT and Preferred Income Fund does. The other half of the fund invests in preferred shares. While there’s some overlap, since REITs often issue preferred shares, that doesn’t make Cohen & Steers an expert in, say, preferreds issued by insurance companies. That’s not to suggest that they don’t have the ability to do analyze such securities, just that their business has historically been structured around REITs. And this fund, with only about 10% of its preferred portfolio in REIT preferreds, is definitely more than just REITs. But what exactly is in RNP? Roughly 50% of the fund is, indeed, in REITs. The largest holdings are basically top-quality players. It’s fairly diversified across nine major sectors, with offices, apartments, and regional malls accounted for nearly half of its real estate exposure. Nothing exciting here. Preferred stocks and debt make up the rest of the fund. That side is concentrated in four sectors. Banking preferred stocks alone make up nearly 55% of this side of the portfolio. Insurance, real estate, and utility preferreds are the other big areas. This speaks more to the nature of the preferred market than to anything else, since these group of industries tends to make the most use of preferred stock. It’s worth taking note of the real estate sector’s 10% position on this half of the fund, which means that REITs, in some form, make up about 55% of RNP’s overall portfolio. The big takeaway from that is that this is not a pure real estate investment trust fund. It was never intended to be, but you should keep this fact in the back of your mind if you own it and front and center if you are looking for a pure REIT fund. How’s it done? Looking at total return, which includes distributions, RNP’s trailing ten year return through year-end 2014 was roughly 8% based on the share price (a little under 7% based on the CEF’s net asset value) according to Morningstar. That’s not bad for a fund with an income focus and is roughly in line with the S&P 500 Index over that span. That, of course, assumes the reinvestment of dividends. The price of RNP is down roughly 30% over that span if you used the dividends. Note, however, that dividends over the last six years have totaled roughly seven dollars or so. That pretty much makes up for the entire share price decline right there. While it’s true that the shares are worth less, you have been paid reasonably well along the way… With the other four years of dividends providing the bulk of your take-home return over the span. So, overall, this is a fine fund if you want a decently performing REIT and preferred combo offering. But you’ll need to keep another factor in mind. The big problem RNP makes use of leverage. Toward the end of last year, the fund’s leverage was at around 27%. Leverage is a double-edge sword, aiding performance in good markets and exacerbating losses in bad ones. For example, in 2007 the fund’s return was -27%, according to Morningstar. In 2008 it returned -60%. Those are hard losses to watch unfold and include dividend payments. That said, in 2009 RNP was up 90%, including dividends, and in 2010 it advanced another 50%. So while the fund owns what some would consider “safer” investments, this fund is anything but conservative. This is a fact that shouldn’t be taken lightly. Note, too, that the fund’s inherent exposure to financial preferred stocks on the preferred side of the portfolio were a huge drag during the financial-led 2007 to 2009 recession, when the CEF was hard hit in the market. This type of volatility doesn’t make RNP a bad fund, it just means it’s probably not appropriate for conservative investors. Expenses, meanwhile, at around 1.8%, are elevated by the costs of that leverage. Right now the shares trade at about a 12% discount to NAV. That’s roughly in-line with the fund’s five- and 10-year average discounts of roughly 10%, according to the Closed-End Fund Association. So RNP is hardly on sale right now. But you will be picking up a yield of around 6.75%. At the end of the day The question you have to ask is if that amount of income, most of which has recently been dividend income, is worth the share price volatility that Cohen & Steers REIT and Preferred Income Fund can experience. And the fund is really only appropriate if you want a mix of REIT and preferred exposure in one fund. At the end of the day, I’d say this is a specialty fund most appropriate for those with strong stomachs. It would be a good way, for example, to outsource “boring” sectors and asset classes while still staying true to an aggressive overall investment approach.