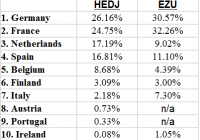
Summary European QE appears likely at the next meeting. In order to overcome German opposition, the QE program may favor northern European bonds and stocks more than anticipated. The bear market in the euro will continue in the wake of QE. Back in December, ECB President Mario Draghi said consensus wasn’t needed for a QE program. The stumbling block in Europe has been several hard money nations led by Germany . These are the countries often lumped together as part of a northern euro block, such as Holland, Austria and Finland, who prefer a strong euro to a weak one. On the other side are the Greeks, Italians, Spanish and French who would do better with a weaker euro. Global investors are giving the south of Europe its wish by selling the euro, but a QE program would be a big help to nations struggling with unsustainable sovereign debts. If a QE program is launched, it will be good news for European equities, and due to the need to overcome German-led opposition, may benefit the north much more than expected. Will There Be European QE? The impetus for a QE policy in Europe is the persistently low inflation on the continent. Falling oil prices knocked consumer inflation below zero in December, which is generally a good thing for the economy, but in the bizarro world of heavily indebted nations, is a scary prospect. Since debt continues to pile up, a rise in purchasing power means the outstanding debt grows in real terms even with no new borrowing. With even the efficient German economy looking at 1 percent GDP growth in 2015, there is a desire for higher inflation and higher nominal growth rates in Europe. To satisfy the demand, the ECB may try an asset purchase program and it has room to expand its balance sheet : … the central bank can still ease policy by expanding the size of its own balance-sheet, which it intends returning to the high of €3 trillion ($3.7 trillion) that it reached in early 2012. That amounts to an extra €1 trillion, though no date has been specified for accomplishing the increase. The previous peak occurred as the ECB averted a funding crisis for banks by providing them with €1 trillion in three-year loans in the winter of 2011-12. Since then its balance-sheet has been waning as banks in northern Europe repaid the money early. One issue the ECB faces is that there is no “European” bond. In order to do QE, it must buy the bonds of member states, but how does it do this fairly? One rumored method is to use the national central bank’s contributions to the ECB, which would mean German bonds would receive the biggest dose of QE money (though not necessarily the biggest dose relative to GDP or outstanding debt). German bonds are already expensive. The yield on 10-year German bonds is below 0.5 percent in part due to low inflation, but also due to investors worried about a breakup in the euro and attracted to northern Europe’s ability to repay its debts. Were the eurozone to break apart, the northern European currencies (or a northern euro) would appreciate in value, while the southern European currencies (or southern euro) would depreciate in value. The German bonds could also be trading down on the anticipation of European quantitative easing. Whatever the reason, investors clearly favor the north over the south and they do so even with rumored QE on the way. As German bond yields fall faster than southern European bond yields, it raises the question of where QE money will go. If the bonds aren’t falling as a result of fears of a possible breakup or Grexit, and QE money is doled out based on contributions, it could mean the bulk of QE money will not make it to southern Europe and instead flow into the assets preferred by investors holding German bonds. Southern Europe will benefit from QE, but the biggest winners might be northern European equity and bond markets. An Important Week For the European Markets The ECB meets on January 22 and three days later, the Greeks vote. Whatever happens, one of the least likely outcomes is business as usual: no QE and a win for the Greek political establishment. A QE policy would smooth financial market concerns ahead of a Greek vote (if they think it helps Syriza, will they delay QE?), and if QE is initiated, it is likely to favor the nations that need it least. The unpredictable Greek election is a major short-term risk for the euro. Although Syriza has maintained a small lead in the polls, the follow on results are unpredictable because party leader Alexis Tsipras’ rhetoric may not match his actions, and the response of the troika is unknown. Adding to the lack of clarity, German officials leaked their opinion that a Greek exit from the euro isn’t the end of the world. ETF Strategy After breaking below the 2010 lows set at the depths of the first Greek sovereign debt crisis, the euro is in a clear bear market with parity looming in the not too distant future. QE or no QE, fundamentals are moving in favor of the dollar and against the euro, with faster GDP growth and higher interest rates as two of the main positives for the greenback. One way to bet against a weak euro is via ETFs such as the PowerShares DB USD Bull ETF (NYSEARCA: UUP ) or the ProShares UltraShort Euro ETF (NYSEARCA: EUO ). While the announcement of a European QE program may be short-term bullish for the euro because traders may “buy the news,” equities have been weak due to the looming Greek election. A QE policy would be net positive for equities because it would increase confidence in the market. While it could lag in the short-term from a euro bounce, the WisdomTree Europe Hedged Equity ETF (NYSEARCA: HEDJ ) is the best option for a bull market in European stocks and a bear market in the euro. Index & Strategy HEDJ has tracked the WisdomTree Europe Hedged Equity Index since August 29, 2012. The main attraction of HEDJ is the currency hedge. An investor in HEDJ receives only the nominal change in the euro denominated value of the stocks. This doesn’t eliminate currency risk; it shifts it. When the euro is weak, HEDJ will beat an unhedged European equity fund, but when the euro is strong, HEDJ will under perform an unhedged European equity fund. The index takes the currency approach a step further though. Here’s an important part of the index description : The Index is based on dividend paying companies in the WisdomTree DEFA Index that are domiciled in Europe and are traded in Euros, have at least $1 billion market capitalization, and derive at least 50% of their revenue in the latest fiscal year from countries outside of Europe . Not only does HEDJ hedge away euro risk, it also holds stocks in companies most likely to benefit from a weaker euro because they export or have extensive multinational operations. We can see how this changes the portfolio by comparing HEDJ to an unhedged eurozone fund, the i Shares MSCI EMU ETF (NYSEARCA: EZU ). Here’s the country exposure for each fund, based on data from the fund providers’ websites as of January 12. The EZU numbers do not add to 100 percent because EZU lists “Other” at 1.30 percent of assets. Both ETFs have heavy exposure in the larger economies of France and Germany, but HEDJ is more balanced in its approach. Sector exposure is another story. HEDJ has about 12 percentage points less in financial than EZU. Financials are more closely tied to the domestic economy and some fall afoul of HEDJ’s rule for owning companies with non-European sourced revenue. That rule also causes the fund to be underweight utilities and energy relative to EZU. HEDJ is overweight the consumer staples, industrial and consumer discretionary sectors, which are represented in the portfolio by major multinational firms such as Anheuser-Busch InBev (NYSE: BUD ), Unilever (NYSE: UL ) and L’Oreal ( OTCPK:LRLCY ). Although financials may be among the beneficiaries of a QE program, HEDJ’s exposure to multinationals is attractive because Europe’s economic prospects aren’t great. Even with QE, the eurozone will be lucky to generate low inflation and growth. The story here is that equity valuations will rise due to liquidity added to the market and increased confidence generated by the central bank’s actions. Unlike the U.S., a breakup of the currency union is a low probability, but high cost event that weighs on European equities whenever fear of a potential breakup spikes. Performance This first chart is a price ratio of HEDJ to EZU. A rising line shows the outperformance of HEDJ. The black line is the EUR/USD exchange rate. This shows changes in the exchange rate, explain the direction of relative performance. HEDJ leads when the euro falls. (click to enlarge) The return chart below shows that the different sector exposure has caused total returns to fluctuate more than by the exchange rate. Since inception as the Europe hedged fund in August 2012 through January 12, HEDJ is beating EZU by more than 10 percent, but the euro is down less than 6 percent over this period. Back in May 2014, EZU was beating HEDJ by about 17 percent since inception, but the euro was only up 10 percent. This behavior is consistent with HEDJ’s index rule on non-European revenues. (click to enlarge) Expenses HEDJ charges 0.58 percent versus 0.48 percent for EZU, a small increase for adding the currency hedging. Risk & Reward This decision tree shows which exposure makes the most sense for different currency and equity situations. Active investors bullish on European equities and bearish on the euro should opt for a fund such as HEDJ. Those investors also bullish on the euro should stick with an unhedged ETF such as EZU. For investors bearish on stocks, but bullish on the euro, holding a currency fund such as the CurrencyShares Euro Trust ETF (NYSEARCA: FXE ) or a bond fund holding euro-denominated bonds is the best option. For those bearish on both stocks and the euro, holding a currency short fund such as EUO is an option, but for many investors, simply avoiding Europe altogether is the best option. (click to enlarge) Conclusion A European QE program will be bullish for European equities, but equities face a major risk from the Greek election. Odds are Europe will choose the easier path of accommodating a political shift in Greece, but there’s a small chance that either Greece or the troika scuttle the bailout agreements. Assuming the extreme path is avoided though, confidence will recover once the Greek election is over and a QE program will further increase it. Meanwhile, QE will be bearish for the euro over the intermediate to long-term. HEDJ is perfectly situated to benefit in an environment of a weak euro and rising European equities.

