Tag Archives: onload

Market Timing Vs. Macro Decision Making

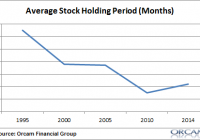
Here’s a very good post over at Brooklyn Investor on some of the differences between market timing and macro hedge funds. As more and more people become index fund investors I think these concepts become increasingly important to understand because all index fund investing is a form of macro investing (picking aggregates). But being an “asset picker” doesn’t make you a “market timer” in the sense that I think many people have come to think. First, market timers are people with extremely short time horizons. These are the people who think they can time the daily, weekly or monthly moves of the market. For some perspective, you can see how much the average holding period has declined over the years: If you go back even further in history the holding period used to be quite a bit longer (as high as 7 years). The crucial point in the discussion about how “active” an investor is really comes down to efficiency in decision making as opposed to “passive” vs “active” (since we’re all “active” to some degree). That is, we all deviate from global cap weighting, we all rebalance, lump sum invest, alter our risk profile, “factor tilt”, etc. Portfolio construction and maintenance is an active endeavor by necessity. The more important questions revolve around how we are optimizing frictions around our decisions. This comes down to two big points: Taxes will take between 15-38% of your profits. Reducing this friction is crucial. A tax aware investor not only uses the proper products to maximize after tax returns, but implements a portfolio that takes advantage of long-term vs short-term capital gains. Fees are the other big friction in a portfolio. As I’ve described before , the difference between using a 1% fee fund and a 0.1% fee fund over the long-term will result in tremendous outperformance: (The fee impact of $100,000 compounded at 7% with avg MF and low fee index) The smart macro investor knows that taxes and fees are a killer in the long-term. If the global financial portfolio generates a return of 7% per year then you can’t afford to be giving away 1% in fees every year and another 1-2%+ to the tax man every year. So here’s a safe rule of thumb – the difference between a “market timer” and someone who makes necessarily “macro decisions” (even if that’s just rebalancing, dollar cost averaging or making new contributions, etc) is 12 months and one day. Since taxes are such a large chunk of our real, real return then it makes sense to take a bit of a longer perspective. Rebalancing on a monthly or quarterly basis doesn’t add much value to your portfolio and increases fees & frictions significantly. At the same time, you have to be careful about the Modern Portfolio Theory concept of “the long-term.” As I described here , taking a “long-term” perspective could actually result in taking much more risk than is appropriate for you. Our financial lives are actually a series of short-terms within one longer time period so it’s best to treat your portfolio as a “savings portfolio” instead of a higher risk “investment portfolio”. As I’ve described in detail , we’re all active investors to some degree. We are all active asset pickers in a world where we all pick asset allocations that deviate from global cap weighting. That’s totally fine! So, the discussion really comes down to how efficient we are at picking our allocations and how we implement the process by which we manage that allocation. If you’re using a very short-term strategy that results in a holding period that is less than 12 months then I’d call you a market timer who is likely increasing your frictions and hurting your overall performance. If, however, you are making macro portfolio decisions in a more cyclical nature (over a year or several years on average) then you are a macro investor who is minimizing the negative impact of portfolio frictions. Of course, the discussion about how to efficiently or effectively we “pick assets” is a whole different discussion and opens up a whole new can of worms in the “active” vs “passive” debate….
If You Think You Are Buying Into Oil, Think Again!

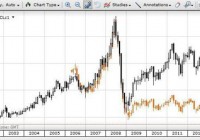
Summary Difficulty in finding a spot oil exposure in the market. USO ETF does not mirror oil price movements perfectly. Long dated oil futures might provide better exposure. There is a lot of hype now looking at oil given the large volatile swings in oil price and its overall drastic decline since about a year ago. For savvy investors, this article would probably not be very relevant because you might already know this. Retail investors who read about oil prices in the news and are very new to this should however, take a closer look. The average investor would probably think of going long or short oil via exchange traded funds, namely the United States Oil Fund or USO. Some information on USO ( website ) As of Jan. 13, 2015 Market Capitalization : 1,688 million Assets Under Management: 1,667 million Management Fee: 0.45% Total Expense Ratio: 0.76% (from 9.30.2014 fund update ) According to the USO website, USO is “designed to track the daily price movements of the West Texas Intermediate (“WTI”) light, sweet crude oil”. For retail investors, this is generally a liquid counter with an average of 16.7 million shares traded daily in the past 3 months. Notably, trading volumes seems to have picked up recently perhaps because of the coverage of oil prices in the news lately. As of Jan 13, the daily volume was 33 million shares traded. Caution is Advised If an investor wants to get exposure to Spot Oil prices without renting a vessel to physically store oil, the investor may have a wrong impression that a good way would be to buy or sell the USO ETF units. Here’s why this is quite ill advised. (click to enlarge) Plotting a chart of the USO ETF with the continuous CLc1 NYMEX prices shows a very obvious trend. In 2009, WTI prices rose from $40 to $80 in a year’s time. During the same period, USO ran up from $29 to $39. A very striking difference in the return profile for an investor who wishes to invest in spot oil prices but ends up buying something different. As prices collapsed in the middle of 2014, from about $100 to right now hitting $45, the USO declined from $37 to about $18. This is also slightly less than the CLc1 movement. For those interested in some numbers, I have extracted out the month-end closing prices of both the USO and the CLc1 in the table below. Month USO CLC1 (spot) USO +/- % CLC1 +/- % Jan-09 29.22 41.75 Feb-09 27.03 44.12 -7.49% 5.68% Mar-09 29.05 48.85 7.47% 10.72% Apr-09 28.63 50.88 -1.45% 4.16% May-09 36.41 66.95 27.17% 31.58% Jun-09 37.93 70.6 4.17% 5.45% Jul-09 36.81 69.5 -2.95% -1.56% Aug-09 36.05 69.57 -2.06% 0.10% Sep-09 36.19 70.4 0.39% 1.19% Oct-09 39.31 76.99 8.62% 9.36% Nov-09 39.16 76.42 -0.38% -0.74% Dec-09 39.28 79.62 0.31% 4.19% Jan-10 35.64 72.64 -9.27% -8.77% Feb-10 38.82 79.61 8.92% 9.60% Mar-10 40.3 83.38 3.81% 4.74% Apr-10 41.33 86.22 2.56% 3.41% May-10 34.05 74.09 -17.61% -14.07% Jun-10 33.96 75.37 -0.26% 1.73% Jul-10 35.34 78.99 4.06% 4.80% Aug-10 31.91 71.68 -9.71% -9.25% Sep-10 34.84 79.81 9.18% 11.34% Oct-10 35.14 81.92 0.86% 2.64% Nov-10 36.04 83.59 2.56% 2.04% Dec-10 39 91.4 8.21% 9.34% Jan-11 38.61 92.22 -1.00% 0.90% Feb-11 39.19 96.87 1.50% 5.04% Mar-11 42.58 106.79 8.65% 10.24% Apr-11 45.15 113.42 6.04% 6.21% May-11 40.5 102.59 -10.30% -9.55% Jun-11 37.26 95.12 -8.00% -7.28% Jul-11 37.43 95.86 0.46% 0.78% Aug-11 34.51 88.72 -7.80% -7.45% Sep-11 30.5 78.75 -11.62% -11.24% Oct-11 35.74 92.58 17.18% 17.56% Nov-11 38.78 100.5 8.51% 8.55% Dec-11 38.11 99.06 -1.73% -1.43% Jan-12 37.82 98.28 -0.76% -0.79% Feb-12 40.92 106.91 8.20% 8.78% Mar-12 39.23 102.93 -4.13% -3.72% Apr-12 39.68 104.89 1.15% 1.90% May-12 32.61 86.5 -17.82% -17.53% Jun-12 31.82 84.84 -2.42% -1.92% Jul-12 32.68 87.96 2.70% 3.68% Aug-12 35.89 96.56 9.82% 9.78% Sep-12 34.13 92.1 -4.90% -4.62% Oct-12 31.78 86.01 -6.89% -6.61% Nov-12 32.56 88.94 2.45% 3.41% Dec-12 33.36 91.79 2.46% 3.20% Jan-13 35.28 97.41 5.76% 6.12% Feb-13 33.06 91.83 -6.29% -5.73% Mar-13 34.76 97.28 5.14% 5.93% Apr-13 33.16 93.32 -4.60% -4.07% May-13 32.61 91.61 -1.66% -1.83% Jun-13 34.15 96.49 4.72% 5.33% Jul-13 37.36 105.32 9.40% 9.15% Aug-13 38.48 107.76 3.00% 2.32% Sep-13 36.85 102.29 -4.24% -5.08% Oct-13 34.69 96.24 -5.86% -5.91% Nov-13 33.46 92.78 -3.55% -3.60% Dec-13 35.32 98.7 5.56% 6.38% Jan-14 34.8 97.46 -1.47% -1.26% Feb-14 36.74 102.76 5.57% 5.44% Mar-14 36.59 101.56 -0.41% -1.17% Apr-14 36.32 99.68 -0.74% -1.85% May-14 37.68 102.93 3.74% 3.26% Jun-14 38.88 105.51 3.18% 2.51% Jul-14 36.31 97.65 -6.61% -7.45% Aug-14 35.76 95.84 -1.51% -1.85% Sep-14 34.43 91.32 -3.72% -4.72% Oct-14 30.63 80.7 -11.04% -11.63% Nov-14 25.58 65.99 -16.49% -18.23% Dec-14 20.36 53.71 -20.41% -18.61% Slight percentage variations in price movements can mean quite a lot to investors. Hence, it is better to understand why this occurs before making a decision to invest. Oil futures are currently in a contango, which basically means oil prices in the future, are worth more than the current price. This usually reflects some cost of handling and storage and cost of carry. (click to enlarge) Looking at the difference between a Dec 2015 futures price of $53.32 versus the front month futures price of $45.99, it may be easy for anyone to simplistically try to mirror a hedge strategy by trying to buy the USO and selling the Dec 2015 futures. The problem lies with how the USO is priced. Here is a snapshot of what the USO holds in its Net Asset Value disclosed: (click to enlarge) (click to enlarge) As shown above, as time progresses, the fund rolls over its holdings from the current front month futures (e.g. Feb 15 futures) into the next month (Mar 15 futures). In the process of rolling over its holdings, it sells the Feb 15 futures and buys the Mar 15 futures, hence incurring the differential cost or spread between the Feb and Mar products. In the USO prospectus page 18, this phenomenon is explained and illustrated in the example quoted below. “If the futures market is in contango, the investor would be buying a next month contract for a higher price than the current near month contract. Using again the $50 per barrel price above to represent the front month price, the price of the next month contract could be $51 per barrel, that is, 2% more expensive than the front month contract. Hypothetically, and assuming no other changes to either prevailing crude oil prices or the price relationship between the spot price, the near month contract and the next month contract (and ignoring the impact of commission costs and the income earned on cash and/or cash equivalents), the value of the next month contract would fall as it approaches expiration and becomes the new near month contract with a price of $50. In this example, it would mean that the value of an investment in the second month would tend to rise slower than the spot price of crude oil, or fall faster. As a result, it would be possible in this hypothetical example for the spot price of crude oil to have risen 10% after some period of time, while the value of the investment in the second month futures contract will have risen only 8%, assuming contango is large enough or enough time has elapsed. Similarly, the spot price of crude oil could have fallen 10% while the value of an investment in the second month futures contract could have fallen 12%. Over time, if contango remained constant, the difference would continue to increase.” Conclusion I hope I have driven the point across on the USO ETF, that it is a means to get exposure to oil price movements, but it is nowhere near a perfectly correlated product.

SPY-TLT Universal Investment Strategy 20 Year Backtest

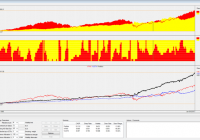
20 year strategy backtest using Vanguard VFINX/VUSTX index funds as a proxy for SPY/TLT. The strategy uses an adaptive SPY/TLT allocation, depending of the market environment. The strategy achieves 2x the return to risk ratio and a 5x smaller max drawdown than a buy and hold S&P 500 investment. In a previous article ” The SPY-TLT Universal Investment Strategy ” I presented a simple strategy which allowed to obtain an excellent return to risk ratio only by investing in variable allocations to the SPDR S&P 500 Trust ETF ( SPY) and the i Shares 20+ Year Treasury Bond ETF (NYSEARCA: TLT ) allocations. The allocation of the SPY/TLT pair is rebalanced monthly using a modified sharpe formula. For the new month, the strategy always uses the allocation ratio which achieved the highest modified sharpe ratio for a given lookback period. Here the algorithm uses a 72 day lookback period and a volatility factor of 2.5 in the modified sharpe formula: sharpe=72 day return/72 day standard deviation ^ 2.5. Several readers asked me now to present a longer backtest of this strategy. Using the Vanguard Five Hundred Index Fund Inv ( VFINX) and the Vanguard Long Term Treasury Fund Inv (MUTF: VUSTX ) as a proxy to the SPY/TLT ETFs, here is now a 20 year backtest for the UIS strategy. These index funds are only used to do the 20 year backtest. To run the strategy you would still invest using SPY and TLT. You can also use futures (ES/UB) or leveraged ETFs ( Direxion Daily S&P 500 Bull 3X Shares ETF ( SPXL)/ Direxion Daily 30-Year Treasury Bull 3x Shares ETF ( TMF) or Direxion Daily S&P 500 Bear 3X Shares ETF ( SPXS)/ Direxion Daily 30-Year Treasury Bear 3x Shares ETF ( TMV)) instead. This is explained in detail in my previous article. With these two Vanguard funds, this is now one of the rare strategies which can be easily backtested for such a long period. In general however, I think that it is much more important, how a strategy performed after 2008. The market has changed considerably during these last years, and if you would only invest in strategies which can be backtested 20 or more years, then you would have missed most of the investment opportunities of the recent years. For the backtest, I use our QuantTrader software. This software is written in C# and allows to backtest and optimize investment strategies using this sharp maximizing approach. You see the screenshot of the results below. The upper chart shows the VFINX/VUSTX performance. The middle chart shows the allocation with red=treasury and yellow=S&P500. If you look at this allocation, then you see that the market is in fact oscillating between “risk on” bull stock markets and “risk off” bear stock markets (= bull treasury market). Overall, you can say that for buy and hold investors, treasuries have been the better investment for the last 20 years. The sharpe ratio (return to risk) of the VUSTX treasury is 0.79, while the sharpe of the VFINX S&P500 fund is only 0.5. With VFINX/VUSTX combined, the strategy achieves a sharpe of 1.28, which is more than double the return to risk ratio of a stock market investment. This means, that instead of investing 100’000$ in the U.S. stock market, using leverage, you could invest 250’000$ in the UIS strategy. This way you would have the same risk, but you would get 20%-30% annual return. The strategy shows a very smooth equity line and the real max drawdown is well below 10%. The 11.68% drawdown peak measured in 2008 was in fact only an extreme mean-reversion reaction following a near 20% treasury up spike. The max drawdown is more than 5x smaller than a buy-and-hold stock market investment. Personally I think, this is in fact the biggest argument for such a strategy. All together, we had several major market correction like the 2000 tech bubble dot-com crisis, the 2001 9/11 attack, the 2003 Gulf war, the 2008 subprime crisis, the 2011 European sovereign debt crisis and lots of other smaller corrections. The UIS strategy always performed very well during these corrections. From 1995 to 2007, the UIS strategy had quite a stable 12% annual return. After 2008, the UIS return increased to 15% annually. The main reason for this improvement is the increased volatility and momentum factors present in the market. After the 55% correction of the U.S. stock market in 2008, VFINX had a lot to recover the last years. In fact, the normal average growth rate of the S&P 500 is about 9% and not 15% like it was during the last 5 years. The UIS strategy “likes” market corrections from time to time, because then the strategy can profit during the down market from treasuries going up and when the market goes up again, then the strategy can profit a second time from a higher stock market allocation. This way, the strategy can return more than each of the two single ETFs. If you want to check the monthly investments of this strategy, then you can download here the full backtest Excel file: 20 year performance log UIS VFINX VUSTX (click to enlarge) Source: Logical-invest.com