Tag Archives: onload

Diversify With A Cheap, Broad Munis Bond ETF

Investors may be exposed to markups when buying individual muni debt securities. Diversify with a broad municipal bond ETF instead. A look at muni bond ETF options, including short-duration plays. Fixed-income investors may be paying more than necessary when purchasing individual municipal debt securities. On the other hand, people can use munis exchange traded funds for a cheap way to access the market. Three U.S. regulators have began scrutinizing municipal bond markup fees that could cut into investor returns, reports Aaron Kuriloff for the Wall Street Journal . The markup shows the difference between a muni debt security’s current offering price among dealers and the higher price a dealer charges a customer. The markup typically occurs when a dealer acts as a principal who buys and sells from a personal account as opposed to brokers who facilitate trades for a nominal fee. As an alternative, Allan Roth, founder of Wealth Logic, believes that investors should use low-fee bond funds instead, arguing that markups the funds pay are smaller since ETF providers purchase in bulk and are more acquainted with the market. Additionally, Roth points out that muni funds can instantly help investors diversify through one single investment since the bond funds hold hundreds if not thousands of individual debt securities. For instance, the iShares National AMT-Free Muni Bond ETF (NYSEArca: MUB ) has a 0.25% expense ratio and includes 2,470 component holdings. The SPDR Nuveen Barclays Municipal Bond ETF (NYSEArca: TFI ) has a 0.23% expense ratio and 535 holdings. The Market Vectors Intermediate Municipal Index ETF (NYSEArca: ITM ) has a 0.24% expense ratio and 985 components. “Even if I have $5 million to buy municipal bonds, I really can’t diversify enough by buying individual bonds,” Roth said in the article. “And if I have $500,000, then I really can’t diversify.” Moreover, while purchasing individual bonds from one’s home state provides additional tax breaks, an investor may be overexposed to their state, especially the bond is based off the economy that supports his or her job and home, Roth added. With muni ETFs, investors can also spread out risk with various state exposure. The three muni ETFs are market-cap weighted, so the states with the largest outstanding debt have the biggest weights, which include California, New York and Texas, respectively. Additionally, some analysts and advisors suggest sticking to short- or intermediate-term funds since long-term bond funds are more susceptible to interest rate risks. MUB has a 6.34 year duration, ITM has a 6.92 year duration and TFI has a 7.14 year duration. There are also a number of short-term municipal bond ETFs available, including the SPDR Nuveen Barclays Short Term Municipal Bond ETF (NYSEArca: SHM ) , which has a 2.89 year duration, Market Vectors-Short Municipal ETF (NYSEArca: SMB ) , which has a 3.1 year duration, and iShares Short Term National AMT-Free Muni Bond ETF (NYSEArca: SUB ) , which has a 2.06 year duration. The Vanguard Group is also planning its first foray into the muni bond ETF space with the Vanguard Tax-Exempt Bond Index Fund, which will track the S&P National AMT-Free Municipal Bond Index. Max Chen contributed to this article .
Leverage Can Kill

Back in 2011 I highlighted the three biggest risks to most portfolios: Leverage Concentration Illiquidity With the SNB shocker this is a perfect time to revisit that thinking because we’re seeing a lot of carnage out there as a result of these three factors. Leverage multiplies the moves in assets. Borrow 100% and you’ve increased your beta or volatility by 2X. In volatile asset markets or markets that allow extreme leverage this can be particularly dangerous. FX and futures markets often allow much more than 2X leverage. $10 can be leveraged into $100 which means 100% of your capital can be wiped out by just a 10% move. In a market like the FX markets where 10% moves are uncommon, but not unheard of, this is a crazy way to try to generate returns. You’re a gambler, not an investor. You have to understand how much more risk you’re taking by leveraging something up. This is further multiplied when it’s done in a concentrated portfolio position. You’re narrowing all your risk down to a few assets and then leveraging. And as we now know, the SNB move resulted in widespread illiquidity which made the market losses that much worse. I’ve talked about the dangers of trading leveraged ETFs in the past because they tend to result in volatility clusters and expose investors to tail risk. But this also extends to FX markets, futures markets as well as most other markets. You have to really know what you’re doing when you engage in such a market. Leverage itself doesn’t kill people, people kill people. And people who don’t understand leverage or abuse it will inevitably get killed by it. I think there’s a good rule of thumb that comes from all of this. Most of us really don’t need to use leverage in our portfolios. Yes, it can be a useful tool in the right hands, but what leverage does to most portfolios is increase the probability of a tail risk event thereby increasing the risk of permanent loss. So, when the SNB comes in and does something that no one expects then a 20% move turns into a 100% loss for a lot of leveraged asset holders. No one needs that sort of added risk in a portfolio. So, when in doubt, stick to the old Warren Buffet rule: “don’t invest in what you don’t understand.” Odds are, you don’t understand leverage and don’t need to. For most of us, investing is actually just the act of allocating our savings. Unfortunately, the allure of “market beating returns” and the myth that we’ll “get rich quick” in the markets is powerful and leads people to do things that are often irrational. When in doubt avoid leverage. Now that you’ve read this, are you Bullish or Bearish on ? Bullish Bearish Sentiment on ( ) Thanks for sharing your thoughts. Why are you ? Submit & View Results Skip to results » Share this article with a colleague

Materials ETF: XLB No. 8 Select Sector SPDR In 2014

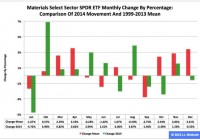
Summary The Materials exchange-traded fund finished eighth by return among the nine Select Sector SPDRs in 2014. The ETF was a winner in the first and second quarters, flattish in the third and a loser in the fourth. Seasonality analysis indicates its downward trajectory could continue in the first quarter. The Materials Select Sector SPDR ETF (NYSEARCA: XLB ) in 2014 ranked No. 8 by return among the Select Sector SPDRs that section the S&P 500 into nine subdivisions. On an adjusted closing daily share-price basis, XLB progressed to $48.58 from $45.33, a yield of $3.25, or 7.17 percent. Accordingly, it lagged its sibling, the Utilities Select Sector SPDR ETF (NYSEARCA: XLU ) and parent proxy, the SPDR S&P 500 Trust ETF (NYSEARCA: SPY ) by -21.57 and -6.29 percentage points, in that order. (XLB closed at $47.19 Wednesday.) XLB also ranked No. 8 among the sector SPDRs in the fourth quarter, when it behaved worse than XLU and SPY by -14.60 and -6.32 percentage points, respectively. And XLB ranked No. 6 among the sector SPDRs in December, when it performed worse than XLU and SPY by -4.13 and -0.30 percentage points, in that order. Figure 1: XLB Monthly Change, 2014 Vs. 1999-2013 Mean (click to enlarge) Source: This J.J.’s Risky Business chart is based on analyses of adjusted closing monthly share prices at Yahoo Finance . XLB behaved worse in 2014 as it did during its initial 15 full years of existence based on the monthly means calculated by employing data associated with that historical time frame (Figure 1). The same data set shows the average year’s weakest quarter was the third, with an absolutely large negative return, and its strongest quarter was the fourth, with an absolutely larger positive return. Inconsistent with this pattern last year, the ETF actually had a loss in Q4. Figure 2: XLB Monthly Change, 2014 Versus 1999-2013 Median (click to enlarge) Source: This J.J.’s Risky Business chart is based on analyses of adjusted closing monthly share prices at Yahoo Finance. XLB performed a little worse in 2014 than it did during its initial 15 full years of existence based on the monthly medians calculated by using data associated with that historical time frame (Figure 2). The same data set shows the average year’s weakest quarter was the third, with an absolutely large negative return, and its strongest quarter was the fourth, with an absolutely larger positive return. It also shows there is no historical statistical tendency for the ETF to explode in Q1. Figure 3: XLB’s Top 10 Holdings and P/E-G Ratios, Jan. 14 (click to enlarge) Note: The XLB holding-weight-by-percentage scale is on the left (green), and the company price/earnings-to-growth ratio scale is on the right (red). Source: This J.J.’s Risky Business chart is based on data at the XLB microsite and Yahoo Finance (both current as of Jan. 14). LyondellBasell Industries NV (NYSE: LYB ) aside, XLB’s top 10 holdings appear to range between fairly valued and overvalued (Figure 3). And these kinds of valuations seem unlikely to function as tailwinds for the ETF this quarter, even though the numbers on the S&P 500 materials sector reported by S&P Senior Index Analyst Howard Silverblatt Dec. 31 indicated the sector’s valuation is not superstretched, with its P/E-G ratio at 1.26. However, I suspect XLB will continue to be a laggard among the Select Sector SPDRs in Q1, mostly because of the bias divergence in monetary policy at major central banks around the world. On the one hand, the U.S. Federal Reserve is oriented toward tightening; on the other hand, the Bank of Japan, European Central Bank and People’s Bank of China are oriented toward loosening. This bias divergence has had important effects on currency-exchange rates, such as the one centered on the euro and U.S. dollar pair: The EUR/USD cross dipped from as high as $1.3992 May 8 to as low as $1.1753 Jan. 8, a drop of -$0.2239, or -16.00 percent. This change in EUR/USD and similar moves in other currency pairs could pressure earnings of U.S. companies in sectors with substantial international businesses. It is noteworthy the Fed announced the conclusion of asset purchases under its latest quantitative-easing program Oct. 29 and may announce the beginning of interest-rate hikes April 29. Its ending of purchases under its first two formal QE programs this century is associated with a correction and a bear market in large-capitalization equities, as evidenced by SPY’s falling -17.19 percent and -21.69 percent in 2010 and 2011, respectively. If one were to argue that this time is different, then I would have to wonder: Why? Disclaimer: The opinions expressed herein by the author do not constitute an investment recommendation, and they are unsuitable for employment in the making of investment decisions. The opinions expressed herein address only certain aspects of potential investment in any securities and cannot substitute for comprehensive investment analysis. The opinions expressed herein are based on an incomplete set of information, illustrative in nature, and limited in scope. In addition, the opinions expressed herein reflect the author’s best judgment as of the date of publication, and they are subject to change without notice.