Tag Archives: onload

ETF Deathwatch For January 2015: The Year Begins At 322

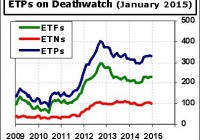
ETF Deathwatch begins 2015 with 322 products on the list, consisting of 222 ETFs and 100 ETNs. Fourteen names joined the lineup this month and nineteen exited. Just nine came off due to improved health, while the other ten met their death and no longer exist. Despite the closure of about 450 ETFs and ETNs over the past decade, there are still 322 zombie products remaining, and they average just $6.4 million in assets. The average age of these products is 47 months, more than enough time to attract a little investor interest. Clearly, these products are neither desired by investors nor profitable for their sponsors, making one tend to wonder why they still exist. The fourteen new names on the list this month include a dozen based on MSCI indexes, nine ‘quality’ ETFs from State Street SPDRs, and two ‘low volatility’ products from BlackRock iShares. There are dozens of successful products tracking MSCI indexes, carrying SPDR and iShares brands, and pursuing factor-based strategies, yet these new additions are struggling. The recipe for success obviously requires more than just having the right ingredients. Thirty-six brand names appear on ETF Deathwatch, and two of these brands have their entire product line on the list. All five Columbia ETFs are included. These actively managed funds have been on the market about five years, yet none have gathered more than $10 million in assets. QuantShares is the sponsor of four ETFs, all more than three years old, all with less than $4 million in assets, and all on ETF Deathwatch. It’s now 2015, which means a second calendar year has come and gone without the iPath Short Enhanced MSCI Emerging Markets Index ETN (NYSEARCA: EMSA ) registering a single trade. November 9, 2012 was the last time EMSA saw any action, and there were only 100 shares traded that day. It was just one of eight products going the entire month of December without a transaction. Additionally, 145 products failed to register any volume on the last day of the year. Here is the Complete List of 322 Products on ETF Deathwatch for January 2015 compiled using the objective ETF Deathwatch Criteria . The 14 ETPs added to ETF Deathwatch for January: First Trust ISE Global Platinum (NASDAQ: PLTM ) iPath Bloomberg Industrial Metals ETN (NYSEARCA: JJM ) iShares MSCI Asia ex Japan Minimum Volatility (NYSEARCA: AXJV ) iShares MSCI Emerging Markets Consumer Discretionary (NASDAQ: EMDI ) iShares MSCI Europe Minimum Volatility (NYSEARCA: EUMV ) SPDR MSCI Australia Quality Mix (NYSEARCA: QAUS ) SPDR MSCI Canada Quality Mix (NYSEARCA: QCAN ) SPDR MSCI EAFE Quality Mix (NYSEARCA: QEFA ) SPDR MSCI Emerging Markets Quality Mix (NYSEARCA: QEMM ) SPDR MSCI Germany Quality Mix (NYSEARCA: QDEU ) SPDR MSCI Japan Quality Mix (NYSEARCA: QJPN ) SPDR MSCI Spain Quality Mix (NYSEARCA: QESP ) SPDR MSCI United Kingdom Quality Mix (NYSEARCA: QGBR ) SPDR MSCI World Quality Mix (NYSEARCA: QWLD ) The 9 ETPs removed from ETF Deathwatch due to improved health: First Trust Developed Markets x-US Small Cap AlphaDEX (NYSEARCA: FDTS ) First Trust Managed Municipal (NASDAQ: FMB ) Global X Junior MLP ETF (NYSEARCA: MLPJ ) iPath Pure Beta Broad Commodity ETN (NYSEARCA: BCM ) iShares Currency Hedged MSCI EAFE ETF (NYSEARCA: HEFA ) PowerShares DB Crude Oil Short ETN (NYSEARCA: SZO ) ProShares Global Listed Private Equity (BATS: PEX ) RevenueShares ADR (NYSEARCA: RTR ) Teucrium Soybean (NYSEARCA: SOYB ) The 10 ETPs removed from ETF Deathwatch due to delisting: Market Vectors Bank and Brokerage (NYSEARCA: RKH ) Market Vectors Colombia (NYSEARCA: COLX ) Market Vectors Germany Small-Cap (NYSEARCA: GERJ ) Market Vectors Latin America Small-Cap (NYSEARCA: LATM ) Market Vectors Renminbi Bond (NYSEARCA: CHLC ) Teucrium Natural Gas (NYSEARCA: NAGS ) Teucrium WTI Crude Oil (NYSEARCA: CRUD ) EGShares Emerging Markets Dividend Growth (NYSEARCA: EMDG ) EGShares Emerging Markets Dividend High Income (NYSEARCA: EMHD ) Direxion Daily Gold Bear 3x Shares (NYSEARCA: BARS ) ETF Deathwatch Archives Disclosure covering writer, editor, and publisher: No positions in any of the securities mentioned . No positions in any of the companies or ETF sponsors mentioned. No income, revenue, or other compensation (either directly or indirectly) received from, or on behalf of, any of the companies or ETF sponsors mentioned.
Which Junk Bond ETF Is Best For 2015? Part 1

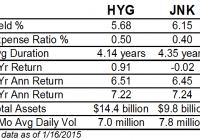
Summary JNK has a higher yield and lower expenses. HYG has higher credit quality and lower volatility. JNK and HYG have near identical returns over the past 5 years. Both have seen their payouts decline along with interest rates. The two largest high yield bond funds are the iShares iBoxx $ High Yield Corporate Bond (NYSEARCA: HYG ) and the SPDR Barclays Capital High Yield Bond ETF (NYSEARCA: JNK ). These funds use very similar strategies that result in largely similar portfolios and performance, with a few small variations. Index & Strategy HYG tracks the Markit iBoxx USD Liquid High Yield Index , while JNK tracks the Barclays High Yield Very Liquid Index. These two funds are highly correlated, to the tune of 0.9985 since 2006. Since 2010, the correlation rises to 0.9995. This comparison of some key data points reveals the main differences between the funds. Through January 16, these ETFs had near identical 3-year and 5-year annualized returns. Investors can pocket a little more income with JNK, but total returns are very similar. Along with that slightly higher yield comes a slightly higher duration, making JNK a little more sensitive to changes in interest rates. HYG has more assets and higher average dollar trading volume. The number of shares traded is very similar, but HYG’s price is more than double that of JNK. JNK is cheaper than HYG, to the tune of 0.10 percent a year. Given the similarities between the funds, the difference in cost is a big advantage for JNK. Even though HYG is at disadvantage on cost and yield, it has managed to outperform JNK. In terms of credit quality, JNK has 40 percent in BB rates bonds; 43 percent in B; and 16 percent in CCC or lower. HYG has 48 percent in BB rated bonds; 39 percent in B; and 11 percent in CCC. Performance This price ratio chart of HYG versus JNK shows the funds move in tandem, except during the financial crisis. Over the past 5 years, the two funds have fluctuated within a range of 3 percent of each other. A rising line indicates HYG is outperforming. (click to enlarge) This price ratio chart compares the price performance of HYG and JNK over the past 5 years without adjusting for dividends. It shows that HYG has benefited more from price appreciation than from income, as would be expected given HYG yields less, yet returns the same in the long-run. (click to enlarge) This chart shows their returns since 2010. (click to enlarge) Income JNK has a higher yield than HYG, but both funds have seen their payout decline amid low interest rates (data from the provider websites). (click to enlarge) The chart below shows the trailing 12-month yields based on actual payouts. JNK was paying more at the start in part because shares did under perform during the financial crisis. The main takeaway is that yields were falling due to falling interest rates (rising bond prices) and if that trend continues, investors will continue to see shrinking payouts. (click to enlarge) Risk & Reward JNK has a 3-year beta of 1.17 versus HYG’s beta of 1.09., both versus the BofAML HY Master II Index. JNK has a 3-year standard deviation of 5.33 compared to HYG’s standard deviation of 5.01. This means JNK is slightly more volatile than HYG. Both funds have exposure to the energy sector, with HYG’s provider listing its exposure at 13.82 percent. JNK does not break out its exposure by sector, but given the volatility in that sector, if it had a meaningful difference in exposure, there would be a considerable difference in returns. JNK is down 1.15 percent in the past three months versus a 0.26 percent drop in HYG. High yield bonds are less sensitive to changes in interest rates due to their lower duration, but they are very sensitive to the economy. In 2008, JNK fell 25.67 percent and HYG lost 17.37 percent. The late 2014 plunge in oil prices weighed heavily on junk bond funds. Including dividends, HYG is down about 3 percent over the past seven months, versus the 4 percent decline in JNK. The most recent turnover data from Morningstar shows JNK had turnover of 30 percent as of June 30, 2014, while HYG had turnover of 11 percent as of February 28, 2014. If HYG has historically maintained this lower turnover, this makes the cost gap smaller than the expense ratio indicates, since HYG would face fewer transaction costs. Conclusion JNK and HYG are very similar funds, but they do have their differences. JNK charges less and has a higher yield, but that comes with higher volatility and lower credit quality. HYG manages to consistently deliver nearly the same total return as JNK though. Overall, this makes HYG the more attractive ETF, especially given our position in the economic cycle. A recession isn’t brewing yet, but it has been seven years since the last one began. With better credit quality, HYG is likely to hold up better again in the next recession. Investors will receive a smaller yield from HYG, but this extra bit of income isn’t worth the risk of under performing the next time the high yield bond market suffers a major sell-off. Short-Term High Yield While HYG is a better choice than JNK in 2015, there are more funds to consider. In part 2, we’ll look at the SPDR Barclays Capital Short Term High Yield Bond ETF (NYSEARCA: SJNK ) and the PIMCO 0-5 Year High Yield Corporate Bond Index ETF (NYSEARCA: HYS ).

Bonds To Bring Stability To Our 1% Portfolio

We are taking a bond position (low cost ETF) but not fully using our $180,000 allocated capital as bonds are too overbought right now. Hedging TIPS against US Treasury bonds is an option if you don’t want any to the corporate bond or short term bond sector. We now have $350k invested in our portfolio. Agricultural commodities are next on our radar. We have purposefully not invested in bonds thus far in our portfolio as I have been conducting extensive research into this area. To many, bonds are a boring vehicle as the returns are usually less than other asset classes. However they are vital in any portfolio as they bring stability and expectation as they are far less volatility than stocks. I am a firm believer that if you are approaching retirement, bonds should be a fundamental part of your portfolio and should outweigh your stock holdings. We have $180k to deploy in this asset class in our portfolio but we are not going to deploy all our available capital here just yet. Let’s go through this article and discuss why we are going to invest less and what bond vehicle(s) we are going to use in our portfolio. In a previous article, I spoke about portfolio re-balancing and position sizing in respective asset classes. I outlined that when an asset class becomes “Top Heavy” for us, we usually take some capital off the table and deploy that capital elsewhere in depressed sectors. Bonds have been on a glorious run for the past while with some analysts calling for a top anytime soon. Look at the charts below (10 year and 1 year) for (NYSEARCA: TLT ) and (NYSEARCA: IEF ) which are 20 and 10 year bond ETFs respectively. (click to enlarge) (click to enlarge) The 20 year bond has really outperformed recently with 28% gains in the last year alone which is extremely high for bonds. We do not want to deploy all our capital into this asset class just yet as I’m wary of the downside here. Nevertheless, the US bond bull may have many months and years to go as US dollar denominated funds are still seen as a safe haven by investors all over the world. We are not going to bet against the US government so $100,000 is going to be invested here instead of the allocated $180,000. So which bonds are we going to invest in? Let’s discuss. I looked first at “Treasury bills or T-bills”. These are short term instruments that don’t go beyond 12 months so they are essentially short term bonds. Next we have “Treasury notes” which mature from anything from one to ten years. These are good for income investors as the interest rate is fixed and you get interest payments every six months. Then you have our good old fashioned Treasury bonds, which are mid to long term (10 to 30 years). Finally we have TIPS, which are inflation adjusted. These bonds go up in value if inflation increases or down in value if deflation takes hold. TIPS are used by many professional investors as a hedge against long term treasuries. Long term treasuries usually fall in value (opposite to TIPS) when interest rates rise. This was an option I definitely looked at for our portfolio. However there are also corporate bonds where corporations pay you income in exchange for a fixed interest rate on your bond over a period of time. Blue chip US multinationals corporate bonds yield slightly higher returns than US Treasuries but since these bonds are related to equities, they also are more volatile. Another thing I am conscious of in our 1% portfolio is fees and commissions. Even though we are excellently diversified, we spend our fair share on broker commissions through the buying and selling of our underlyings. We currently have 40 positions in our portfolio and even though we have a very cheap broker, I hate giving money away. Also since bonds are far less volatile instruments than stocks, we will not be selling covered calls in this sector. The reward doesn’t justify the risk. Therefore I have decided to go with the Vanguard Total Bond Market ETF (NYSEARCA: BND ) and not go with multiple positions in this asset class. This asset class is to be our portfolio anchor. This ETF has returned 6% in capital gains over the last 5 years (see chart) and currently has a healthy 2% yield. What attracted me was the diversity (3000 US related bonds) and the expense ratio which is a very low 0.08%. (click to enlarge) So to sum up, we are investing $100k today into and holding for the medium to long term. If bonds start to lose value, then we have an extra $80k ready to deploy into this asset class if needs be. We now as of 20-01-2015 have in the region of $350k invested. (click to enlarge) Now that you’ve read this, are you Bullish or Bearish on ? Bullish Bearish Sentiment on ( ) Thanks for sharing your thoughts. Why are you ? Submit & View Results Skip to results » Share this article with a colleague