Tag Archives: onload

A Low-Tech Index Offering Exposure To The High-Tech Sector

By Robert Goldsborough Investors craving a big helping of large-cap growth stocks with a strong tilt toward the technology sector can consider PowerShares QQQ ETF (NASDAQ: QQQ ) . A perennial favorite among U.S. large-cap growth investors, QQQ is the sixth most actively traded U.S. exchange-traded fund and has the sixth-most assets of any U.S. ETF. QQQ also offers exposure to leading Nasdaq-listed consumer discretionary firms (18% of assets) and biotech firms (15% of assets) and tracks the cap-weighted Nasdaq-100 Index, which includes the 100 largest nonfinancial stocks in the Nasdaq Composite Index. Given its narrow sector focus, this ETF would work best as a satellite holding in a diversified portfolio. This is a high-quality portfolio with a mega-cap tilt, with more than 87% of assets invested in large-cap companies and more than 93% of assets invested in companies with Morningstar Economic Moat Ratings, those that Morningstar’s equity analysts deem as having sustainable competitive advantages. However, given this fund’s sector tilts, it is more volatile than a broad portfolio of large-cap stocks. For example, over the past 10 years, it has had a volatility of return of 18.0% compared with 14.6% for the S&P 500. When considering whether to invest, investors should take note of the fact that stocks in this fund make up almost the entire 20% tech component of the S&P 500. Despite the relatively low overlap, QQQ has a high correlation in performance with the S&P 500 (90% over the past 10 years) and an even higher correlation with the large technology ETF Technology Select Sector SPDR (NYSEARCA: XLK ) (98% over the past 10 years). Fundamental View The U.S. technology sector dominates QQQ and accounts for fully 58% of its assets, and large-cap tech firms’ performance determines its fortunes. The single largest dynamic affecting the tech sector right now is the shift to mobile computing and growth in cloud computing. Mobile and cloud computing are truly disruptive forces in the tech sector. As users shift to mobile devices, PC sales continue to fall. Global PC shipments dropped by 10% in 2013 and were flat to slightly down in 2014, with developed markets stabilizing but emerging markets seeing declines, as users shift to tablets. Despite sluggishness in PC sales, the total number of devices sold is expected to rise meaningfully in the years to come, as consumers and businesses adapt to smartphones and tablets. Our analysts project that some 2.6 billion-plus computing devices will ship in 2017–more than twice the total number of devices that shipped in 2012. Across the tech sector, firms are reshaping their portfolios for this ongoing transition. Microsoft (NASDAQ: MSFT ) in 2013 acquired Nokia’s (NYSE: NOK ) handset business and has developed the Windows Phone operating system, while Intel (NASDAQ: INTC ) has invested heavily in producing microprocessors optimized for mobile devices. Apple (NASDAQ: AAPL ) leads the marketplace with its iPhone and iPad, continually gaining share from struggling competitors. And Google (NASDAQ: GOOG ) (NASDAQ: GOOGL ) long has had a dominant position in Internet search and has aggressively invested in its Android operating system for smartphones and tablets, providing it free of any license fees. Having Google software on the device helps to ensure that when users search, they use Google. Enterprise hardware suppliers also are reshaping their businesses. Broadly, we are confident in tech firms’ positioning for growth in the medium term. Tech firms generally are procyclical in their performance, and with continued economic strength, tech firms generally should do well. The Gartner Group estimates that tech spending grew 3.2% in 2014, measured in constant currency, to $3.8 trillion and forecasts a growth rate of 3.2% in 2015. As large tech firms manage and reshape their businesses to adapt to secular declines in PC demand, we expect that they will continue to find ways to benefit from smartphone and tablet growth. To be sure, not all technology players will win in a world dominated by mobile computing and cloud computing. For instance, we view cloud computing as a moderate threat to all IT infrastructure suppliers, as cloud service providers are technically savvy customers. So as enterprises migrate their infrastructure to these service providers, infrastructure suppliers’ pricing power likely will decrease. Apple makes up 13% of the assets of QQQ and is far and away this ETF’s largest holding. Apple surged in 2014 after a turbulent 2013. The company benefited from strong earnings reports and guidance that beat expectations, driven by solid iPhone unit sales in both developed markets and in China. Although iPad sales have continued to lag, investors have been enthused by the launches of two larger-screen iPhones, Apple Pay, and Apple Watch and what it means for Apple’s continued ability to innovate. We expect Apple to remain a leader in the premium smartphone and tablet markets for years to come. Portfolio Construction Known as the Cubes or the Qubes, this ETF tracks the Nasdaq-100 Index, which was created in 1985 to represent the Nasdaq Composite Index’s 100 largest nonfinancial stocks by market capitalization. The top 10 holdings account for a significant 47% of the portfolio. While Apple has a narrow moat, this ETF’s next-largest eight holdings all have wide moats. The average market cap of this fund’s holdings is about $96.6 billion. The Nasdaq-100 index rebalances once a year, although it has on occasion conducted special index rebalances in order to prevent any one company from having an outsize impact on the index (the index caps any one company’s weighting at 24%). The last special index rebalance took place in 2011 and was driven by the continued overweighting of Apple. Fees This ETF is relatively inexpensive, with an annual expense ratio of 0.20%. Its estimated holding cost is slightly higher, at 0.25%. Estimated holding costs are primarily composed of the expense ratio but also include transaction costs, sampling error, and share-lending revenue. One alternative is Fidelity Nasdaq Composite (NASDAQ: ONEQ ) , which tracks the broader Nasdaq Composite Index. ONEQ contains 1,920 stocks listed on the Nasdaq, making it a much broader portfolio than QQQ’s. Given its broader holdings, ONEQ is less top-heavy, with the top-10 names accounting for about 31.5% of total assets. ONEQ also includes Nasdaq-listed financial stocks, which make up about 6.5% of its portfolio. The average market cap of ONEQ’s holdings (about $31.5 billion) is considerably less than that of the holdings in the Cubes (about $97.0 billion). This can be attributed in part to ONEQ’s 17% exposure to small-cap stocks. ONEQ charges 0.21%, with an estimated holding cost of 0.12%. A cheaper and less volatile large-cap growth fund is Vanguard Growth ETF (NYSEARCA: VUG ) , which has an expense ratio of 0.09%. The performance of QQQ is highly correlated with the performance of VUG (96% over the past five years). Similarly, another large-growth option is iShares Russell 1000 Growth (NYSEARCA: IWF ) , which charges 0.20%. With just more than one third the holdings of ONEQ, IWF is more concentrated than the Fidelity offering. At the same time, it’s far more diverse than QQQ. Even so, QQQ’s performance is highly correlated with the performance of IWF (96% over the past five years). Those seeking more-concentrated exposure to tech names can consider Technology Select Sector SPDR ( XLK ) , which carries a 0.16% expense ratio and holds 71 companies, all of which are information technology and related services, software, telecommunications equipment and services, Internet, and semiconductors. A less-liquid alternative is Vanguard Information Technology ETF (NYSEARCA: VGT ) , which holds 393 companies and charges just 0.12%. Disclosure: Morningstar, Inc. licenses its indexes to institutions for a variety of reasons, including the creation of investment products and the benchmarking of existing products. When licensing indexes for the creation or benchmarking of investment products, Morningstar receives fees that are mainly based on fund assets under management. As of Sept. 30, 2012, AlphaPro Management, BlackRock Asset Management, First Asset, First Trust, Invesco, Merrill Lynch, Northern Trust, Nuveen, and Van Eck license one or more Morningstar indexes for this purpose. These investment products are not sponsored, issued, marketed, or sold by Morningstar. Morningstar does not make any representation regarding the advisability of investing in any investment product based on or benchmarked against a Morningstar index.
Profiting From Greece And ECB Events

Summary Greek election result and what it means for investors. European Central Bank quantitative easing and what to expect from the Euro. Recommendations to profit from these moves. This is a very unusual article for me, as my regular readers will know, since I generally invest long term. I authored another similar article in March of 2012 about the Greek debt situation. This is a special situations and I believe that such opportunities should not be ignored. I also write a series about hedging and this particular situation falls neatly into that category. There are two issues coming out of Europe over the last week: the European Central Bank [ECB] quantitative easing [QE] program and the Greek election results this Sunday, January 25, 2015. The QE announcement was expected, but the size of the program was about twice what was being rumored and caught the markets by surprise. The Greek election turned out about the way early polls implied but still has the potential to create instability on the continent. The two events taken together sends a message that we should be cautious when investing in Europe. But, then again, there may also be some opportunity to profit. Greek Election With about 90 percent of the votes counted it is projected that the Syriza Party will win the election and come away with a total of 149 of the 300 seats in Parliament. That includes the 50 extra seats given to the winning party and leaves Syriza leader, Tsipras, two seats short of an outright majority. That means that Tsipras will need to entice one of the other smaller parties into forming a government. And that is likely to lead to compromise; on what, I do not know. But without having won outright control, Tsipras may not be able to move as far or as fast as his constituents are expecting. That may be good because it will give Tsipras an excuse and may give him more time to negotiate whatever the eventual agreement with the European Union [EU], ECB and the International Monetary Fund [EMF] from which past bailouts have come. The bottom line, in my humble opinion, is that this creates uncertainty in the EZ. Some expect Greek to exit the EU, others expect at least some Greek debt forgiveness, while others expect Greece leaders to cave into the demands of continued austerity. No one knows for sure what will happen. This uncertainty is likely to further undermine the already weakening Euro currency against other major currencies, especially the U.S. dollar. However, since the worst possible outcome of outright control by Syriza (worst case for the EZ) did not occur, the initial impact could be muted. ECB and QE Investors who own shares of companies that are either domiciled in the Euro Zone [EZ] or conduct significant business there, should consider taking steps to protect holdings from what I expect to be additional downside risk from currency translations. The ECB announced last week its intention to initiate a 1 trillion euro quantitative easing program in March 2015 expected to last through at least September of 2016. Now that the initial impact from the program announcement has taken its toll, we may see the Euro drift sideways unless my interpretation of the Greek election is off. Recall what happened to the Japanese Yen relative to the US dollar after the US ended its QE3 and the Japanese Central Bank announced shortly after that it would expand its QE program in late October of last year. There was an initial steep sell off over the first few days followed by a more gradual, but still significant, continued decline in the value of the Yen over the next four weeks. The Yen has continued to trade with a range since that time, but weekly moves are can still be volatile. See the chart of CurrencyShares Japanese Yen ETF (NYSEARCA: FXY ) below. FXY data by YCharts The Euro has been in a downtrend for the last six months (see chart of the CurrencyShares Euro ETF (NYSEARCA: FXE ) below), but the rate of decent increased about the middle of December when Draghi of the ECB indicated that QE in the EZ was coming soon. During this period it was widely accepted that the ECB would initiate a QE program in the range of 500 billion Euros. After the announcement of one trillion Euros hit on January 22, the Euro fell to an 11-year low near $1.1 / Euro. But the program has not even begun yet and will not get started until March! FXE data by YCharts A prolonged QE program aimed at weakening the Euro against the U.S. dollar and other major currencies will, in my opinion, be successful to the extent that the Euro will weaken further. Of course, the idea is that a weakening Euro will make EZ produced goods more competitive in the global marketplace; hence, increasing demand for EZ goods, creating jobs, increasing GDP and moving inflation up a notch or two. The problem is that other central banks are not likely to sit idly by and do nothing. As a matter of fact, both Canada and Denmark cut rates in the last week and Japan is determined to weaken the Yen further; others will likely follow. In other words, the ECB will probably be successful in weakening the Euro against the U.S. dollar and create inflation, but the other goals are less certain. The U.S. Federal Reserve Bank [FED] is unlikely to take further QE actions as such a move could be construed as a retaliatory move. That could move the world dangerously closer to an all-out currency war; something no one wants or needs. Thus, even with short-term U.S. interest rates pegged near zero, the U.S. dollar is more likely to continue to strengthen against other currencies, especially the Euro. Before I make my recommendations I must stress that using leveraged ETFs is always a very short-term strategy. Holding leveraged ETFs long-term, much more than a week, is generally a losing proposition. If you can’t monitor your positions at least once a day, please don’t consider this trading strategy. Unleveraged ETFs are less volatile and can be held longer. Recommendations PowerShares US Dollar Bullish ETF (NYSEARCA: UUP ) is an unleveraged US Dollar Index ETF that goes up when the US dollar rises relative to a basket of other major currencies, including the euro. Daily average volume is 1.7 million shares, a very important point because you don’t want to trade an ETF that is thinly traded and run the risk not being able to close out a position when you want. My theory is that the uncertainty created by the Greek elections combined with the ECB move with put downward pressure on the Euro over the next few weeks and potentially even longer. I own UUP now and may add to my position, primarily as a hedge against currency translation losses by companies that do extensive business in Europe. This position has done well and I expect the trend to continue (see UUP chart below). UUP data by YCharts ProShares Ultra Short Euro ETF (NYSEARCA: EUO ) is a double-leveraged inverse ETF on the euro that goes down twice the amount that the US dollar increases relative to the euro. EUO daily average volume is about 1.3 million shares, thus providing adequate liquidity also. The unleveraged short Euro ETFs did not have adequate trading volume to warrant a recommendation. I do not hold any EUO at this time but plan to take a short-term position within the next week. This is more of a momentum play and not my usual cup of tea, so my position will be very small and short-lived. The trend for EUO has been strong and I believe that there is still more to come, but for how long I do not know (see EUO chart below). EUO data by YCharts Again, this is meant as a means to protect at least some of what you have, not as a get-rich-quick scheme. Don’t plan to hold the position beyond the point when the prices begin to turn against you. It would be prudent to use trailing stops to protect your capital. A drop of more than five percent is significant, thus I would keep my trailing stops at five percent. The leveraged ETFs are very risky securities, and can lose you money if held long-term. It is the nature of how these securities are designed. They can be solid performers over relatively short periods only. Be careful out there! Additional disclosure: I intend to initiate a short-term position in EUO this week.

SPDR S&P 500 ETF : Let’s Analyze It Using Our Scorecard System

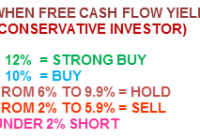
Summary Analysis of the components of the SPDR S&P 500 ETF (SPY) using my Scorecard System. Specifically written to assist those Seeking Alpha readers who are using my free cash flow system. Part II concentrated on “Main Street” while Part I in the series concentrated on “Wall Street” and this final Part III will combine everything into one final result. Back in late December I introduced my free cash flow “Scorecard” system here on Seeking Alpha, through a series of articles that you can view by going to my SA profile . My purpose in doing so was to try and teach as many investors as I could on how to do this simple analysis on their own as I believe in the following: “Give a person a fish and you feed them for a day, Teach a person to fish and you feed them for life” I have been very pleased with the positive feedback that I have received so far, but included in that feedback were many requests by those using my system, to see if they did their analysis correctly or not. Since the rate of these requests have been increasing with every new article I write, I have decided to start a new series of articles here on Seeking Alpha analyzing the SPDR S&P 500 ETF (NYSEARCA: SPY ), where I will analyze each of its components individually. That way those of you using my system will have something like a “teacher’s edition” that will give you all the correct calculations for each component. Obviously I couldn’t include the results for all my ratios in one article, so I will did a series of articles, (where this is the final part) where each ratio’s results for the SPDR S&P 500 ETF will have its own article devoted to it. Hopefully these articles can be used as reference guides that everyone can use over and over again, whenever the need arises. Having said that, I would suggest that everyone first read Part I by going HERE . There you will find the data on my “Free Cash Flow Yield” ratio which is one of three parts that I use it tabulating my final “Scorecard”. While free cash flow yield is a Wall Street ratio (Valuation Ratio), I also wrote an article that concentrated on my “CapFlow” and “FROIC” Ratios, which are Main Street ratios, which you can read by going HERE . In this article I will generate my Scorecard results for each component and basically combine all three ratio results to generate one final result. Once completed, my Scorecard should give everyone a clearer understanding on how accurate the valuation is that Wall Street has assigned each company relative to its actual Main Street performance. Before we show you the final results of my Scorecard, here is brief introduction to how it works: Scorecard The Scorecard is the final score for any company under analysis and this is done by combining the three ratio (listed below) final results into one analysis, we grade each company with either a passing score of 1 or a failing score of 0 per ratio where a perfect final score per stock would be a 3. The ideal CapFlow results are anything less than 33%. The ideal FROIC score is any result above 20%. The ideal Free Cash Flow Yield is anything over 10%. So in analyzing Apple (NASDAQ: AAPL ) for example, we get for TTM (trailing twelve months). For the conservative investor: CAPFLOW = 16% PASSED FROIC = 34% PASSED FREE CASH FLOW YIELD = 7.6% FAILED SCORECARD SCORE = 2 (Out of possible 3) For the aggressive or “Buy & Hold” investor, we get a Scorecard score of 3 as Apple’s 7.6% free cash flow yield would be classified as a buy. These are the parameters for the Free Cash Flow Yield. It is important before preceding to determine what kind of investor you are as determined by the amount of risk you are willing to take. Then once you have done that, then pick the parameter list below that fits your risk tolerance. So without further ado here are the final Scorecard results for the components that make up the SPDR S&P 500 ETF : What my Scorecard also achieves, besides telling you which individual stocks are attractive and which are not, is that it also allows you in “one shot” to see how overvalued or attractively valued the stock market is as a whole. For example, for the conservative investor now is the time to be extremely cautious as only these five stocks came in with a perfect score of “3” Affiliated Managers Group (NYSE: AMG ) Aflac (NYSE: AFL ) General Dynamics (NYSE: GD ) LyondellBasell Industries (NYSE: LYB ) Principal Financial (NYSE: PFG ) As you can see I only found 5 bargains out of 500 for the conservative low risk investor and that comes out to just 1% of the total universe being bargains! As for the aggressive investor, who is willing to take on more risk, we have only 30 stocks that are considered higher risk bargains. That comes out to only 6% being attractive and 94% being holds or sells. So as you can see as a portfolio manager I have to work extremely hard just to find one needle in the haystack, while in March 2009 there were probably 250 bargains for the conservative investor at that time. Thus this data clearly shows that we are at the opposite extreme of where we were in 2009 and are at an extremely overvalued level. Here is the same analysis using the Dow Jones Index where I actually analyzed that index for 2001, 2009 and 2015. You can view those results by going HERE . Here are also the 30 names that passed the “3” test for the more aggressive/buy & hold investor, from the list above. Affiliated Managers Group Aflac General Dynamics LyondellBasell Industries Principal Financial Accenture (NYSE: ACN ) Apple Bed Bath & Beyond (NASDAQ: BBBY ) Citrix Systems (NASDAQ: CTXS ) Coach (NYSE: COH ) CR Bard (NYSE: BCR ) Delta Air Lines (NYSE: DAL ) Dun & Bradstreet (NYSE: DNB ) Edwards Lifesciences (NYSE: EW ) Electronic Arts (NASDAQ: EA ) Expedia (NASDAQ: EXPE ) Fossil Group (NASDAQ: FOSL ) H&R Block (NYSE: HRB ) IBM (NYSE: IBM ) Lockheed Martin (NYSE: LMT ) Microsoft (NASDAQ: MSFT ) NetApp (NASDAQ: NTAP ) PetSmart (NASDAQ: PETM ) Qualcomm (NASDAQ: QCOM ) Rockwell Automation (NYSE: ROK ) Scripps Networks (NYSE: SNI ) Seagate Technology (NASDAQ: STX ) Teradata (NYSE: TDC ) VeriSign (NASDAQ: VRSN ) Western Digital (NASDAQ: WDC ) In getting back to the table the “TOTALS” you see at the end are the sum of each ratio divided by 500. The totals for both Scorecards are out of 1500 (1 point for each ratio result) as a perfect score were every stock would be a bargain. Therefore the conservative scorecard result is 384/1500 or 25.6% out of 100% and the more aggressive/buy & hold scorecard came in at 488/1500 or 32.5% out of 100%. Both clearly are not inspiring and could be a clear sign that the markets are ready for serious correction going forward. Always remember that the results shown above should not be considered investment advice, but just the results of the ratios. The system outlined in this article is just meant to be used as reference material to be included as just “one” part of everyone’s own due diligence. So in other words, don’t make investment decisions based on just my Scorecard results, but incorporate them as part of your own due diligence.