Tag Archives: onload

For Passive Funds, A Stronger Link Between Fees And Performance

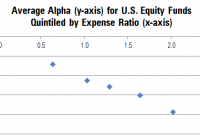
By Michael Rawson When shopping for products of unknown quality, price forms a cue that shoppers can use to differentiate products. It is often a safe assumption that a higher priced product offers better performance than a lower priced product. For instance, the Porsche 911 lists for $93,000 while the Chevy Malibu will set you back $20,000. But this is not always the case, particularly with fund investing. Unlike the Porsche, there is no cachet from buying a high-priced fund. Still, price can be useful when predicting results – though not in the way fund companies would like. Morningstar’s Analyst Rating for funds is based on five pillars: People, Parent, Process, Performance, and Price. The first three of these pillars are somewhat qualitative, while Performance and Price are much more quantitative. Price is the most tangible, both in terms of the impact of price on fund performance and comparability across funds. On average, we find that the higher the price of a fund, the worse its performance tends to be, and the link between fees and performance is stronger for passive funds. The chart below illustrates the relationship between price and performance among U.S. equity funds. It shows the average alpha (excess returns after adjusting for risk relative to the category benchmark) for all funds grouped into five quintiles by expense ratio. The y-axis shows the average alpha and the position on the x-axis indicates the average expense ratio for the group. We included all U.S. equity funds that existed five years ago and survived through today. Because some funds have performance-based fees, we used the 2009 annual report expense ratio rather than the expense ratio during the sample period. This also simulates the results of picking funds based on currently available information and examining future performance. As the chart illustrates, there appears to be an inverse relationship between fees and performance. The lowest-fee quintile has an average expense ratio of 0.64% and an average alpha of negative 0.71%, while the highest-fee quintile has an average expense ratio of 2.02% and an average excess return of negative 1.94%. However, grouping the funds into quintiles masks the tremendous variability in the relationship between fees and performance, which is better illustrated in the following graph. Here, the relationship appears much less precise. In fact, a regression of alpha on expense ratio has an R-squared of just 6%, suggesting that fees explain a small portion of the overall variability in fund performance. However, there are a few issues that may obfuscate this relationship. The chart above includes all U.S. equity funds, even though small-cap funds have higher expense ratios than large-cap funds. It also includes all available share classes despite the fact that low-cost institutional share classes must outperform high-cost retail share classes of the same fund. Also, the relationship between fees and performance might be different for active and passive funds. Because passive funds seek to match an index less fees, the relationship between fees and performance might be stronger among them. In contrast to passive funds, well-run active funds have a better chance of earning back their fees. In order to address these issues, we narrowed our focus to large-cap U.S. equity funds and removed multiple share classes of the same fund to get a cleaner read on the link between fees and strategy performance. We also grouped active and traditional broad passive funds separately and removed most niche index and strategic beta funds (index funds that make active bets in an attempt to outperform traditional indexes). The results are shown in the following chart. In this chart, the relationship between fees and performance is a bit clearer. For active funds, there is still a tremendous amount of variability, but there appear to be more dots in negative territory as we move from lower- to higher-cost funds (from left to right on the chart). Passive funds seem to hew closer to a straight line. Quantifying this relationship with a regression that expresses the expected alpha as a function of the expense ratio highlights the negative slope. For active large-cap funds, the expected alpha is approximately negative 1.21 times the expense ratio. In other words, a fund with an expense ratio 10 basis points above the average would be expected to deliver an alpha 12 basis points lower than average. While the relationship is significant, the R-squared is only 6%. Despite the poor fit of the model linking fees to performance for active large-cap funds, lower-fee funds still had a better chance of outperforming on average. This simply indicates that, while fees are predictive of performance, there are many other factors that matter. For passive large-cap funds, the R-squared is 38%. This means that there is a cleaner relationship between fees and performance for passive funds than active funds. In the sample studied, active funds in the lowest expense ratio quintile had a 28% chance of earning a positive alpha compared with just a 15% chance for those in the highest-cost quintile. But the relationship is even stronger for passive funds. About 52% of passive large-cap funds in the lowest-cost quintile earned a positive alpha (however small), while none of the funds in the highest-cost quintile did. This suggests that investors can increase their probability of success by selecting low-cost funds. Fortunately, there are a lot of low-cost passive and active funds to choose from. Vanguard Total Stock Market ETF (NYSEARCA: VTI ) holds more than 3,000 U.S. stocks and offers similar exposure to iShares Russell 3000 (NYSEARCA: IWV ) . The funds have had similar returns and risks over the past decade. However, the Vanguard fund charges 0.05% compared with 0.20% for the iShares fund. Assuming both funds return 5% annually gross of fees over 10 years, a $100,000 investment in VTI would be worth about $2,300 more at the end of the period than an investment in IWV. Among active funds, Price is one of five pillars taken into consideration in the Morningstar Analyst Rating for funds. When there are multiple funds that offer similar exposure, the lowest-cost option may be the prudent choice. Disclosure: Morningstar, Inc. licenses its indexes to institutions for a variety of reasons, including the creation of investment products and the benchmarking of existing products. When licensing indexes for the creation or benchmarking of investment products, Morningstar receives fees that are mainly based on fund assets under management. As of Sept. 30, 2012, AlphaPro Management, BlackRock Asset Management, First Asset, First Trust, Invesco, Merrill Lynch, Northern Trust, Nuveen, and Van Eck license one or more Morningstar indexes for this purpose. These investment products are not sponsored, issued, marketed, or sold by Morningstar. Morningstar does not make any representation regarding the advisability of investing in any investment product based on or benchmarked against a Morningstar index.
Consider This Before You Sell On Fears Of A Strong Dollar

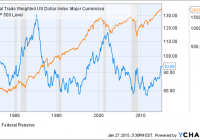
Markets tumbled Tuesday on a number of weak earnings reports. The strong U.S. dollar was a major culprit. Historically, currency changes are not a good predictor of subsequent stock market returns. Investors may wish to consider rebalancing their portfolios, but there is little evidence to suggest a major change in strategy is warranted. Markets had a turbulent Tuesday with earnings reports from firms like Microsoft (NASDAQ: MSFT ), Caterpillar (NYSE: CAT ) and Procter & Gamble (NYSE: PG ) stoking fears that economic growth is slowing. However, a more critical look into these reports suggests that strength in the U.S. dollar is a major culprit. For example, Procter & Gamble reported core earnings of $1.06 versus $1.15 in the previous year, a reduction of nearly 8%. But looking closer net sales were down 4% nearly mirroring a five percentage point impact from foreign exchange. In fact, adjusting for the effects of foreign exchange, volumes were flat (Table 1). While flat growth may be little reason to cheer, it also seems to be scant reason to overreact. As an investor before you react to currency headwinds it is logical to evaluate the effect of a stronger dollar in its historical context. Table 1: P&G’s Net Sales Drivers Oct. – Dec. 2014 Net Sales Drivers Volume Foreign Exchange Price Mix Other* Net Sales Organic Volume Organic Sales Beauty, Hair & Personal Care -2% -4% 1% 0% -1% -6% -2% -1% Grooming -2% -7% 4% 0% 0% -5% -2% 2% Health Care -2% -4% 0% 3% 0% -3% -2% 1% Fabric Care and Home Care 2% -6% 1% 0% -1% -4% 2% 4% Baby, Feminine and Family Care 0% -6% 1% 3% 0% -2% 0% 4% Total P&G 0% -5% 1% 1% -1% -4% 0% 2% *Other includes the sales mix impact of acquisitions/divestitures and rounding impacts necessary to reconcile volume to net sales. Source: Procter and Gamble Earnings Press Release. The stock market is volatile, but so are currencies. Over the past thirty years the dollar has waxed and waned against a basket of foreign currencies (Figure 1). Sometimes the U.S. dollar and the market move upward in lock step, while other times they diverge. Figure 1: The U.S. Dollar vs. The S&P 500 (click to enlarge) Do you see a correlation between the two? I do not and incidentally neither does Excel. The correlation between the dollar index and the S&P 500 (NYSEARCA: SPY ) is -0.211, most likely any correlation is simply an artifact of the dollar being in general more weak over the past ten years while the market has moved up over time. How about if we think about the situation in a different way? What if a rising dollar is associated with subsequent poor performance in the stock market? In other words, since P&G’s last earnings report stemmed from changes in the exchange rate over the past six months what if there was a correlation between the six month appreciation or depreciation of the dollar and subsequent returns in the stock market? These numbers are very easily manipulated in Excel and the correlation between six month past currency moves and three month forward stock market returns is -0.043. There is almost no correlation between the two. To further emphasize the point I created a scatterplot of the two data sets (Figure 2). The R squared of least squares regression is 0.00186, indicating no correlation. Figure 2: Three Month Subsequent S&P 500 Return Vs. Six Month Prior Appreciation in the U.S. Dollar (click to enlarge) Intuitively, this finding makes a great deal of economic sense. Currency moves are a zero sum game. If the dollar goes down against the Euro then U.S. exports are cheaper for Europeans and the reverse is true for imports. While U.S. companies on the whole may suffer because they sell abroad an appreciating dollar also makes assets denominated in dollars more attractive to foreign investors. In aggregate there is little reason to bet on the dollar causing the U.S. market to move up or down. Some market pundits are calling for a correction or worse in the stock market, however, there is no historical evidence to suggest that strength in the U.S. dollar should be correlated with stock market corrections. The S&P 500 closed at 2029 today, about 3% off its all-time intraday high of 2093. While market prognosticators constantly pitch timing the market, moves of less than 10% are impossible to time accurately. By the time the market opened today we were already down 3% from all-time highs. What if the market goes down a total of 10%? First consider that it is only after a move higher that you would know to reenter the market. Then consider that it is equally likely the market’s next move will be up. In a nutshell this explains why timing short-term corrections is a waste of time and money, although investors never seem to learn that this is the case. At the moment currency changes are still rippling through the market. One way to rebalance your portfolio would be to favor domestic stocks that capitalize on cheaper imports and sell their products within the United States. Foreign stocks that are exporters should benefit from the opposite trend and allow for a portfolio that is still balanced between foreign and U.S. based corporations. For example, some U.S. based companies that should see stronger earnings as the result of dollar appreciation are: AutoNation (NYSE: AN ), Costco (NASDAQ: COST ) and Michael Kors Holdings (NYSE: KORS ). These three companies need to import goods from abroad and sell them in the United States (with each having a minimum of 70% of revenues domestically). Foreign stocks that could benefit from a weaker euro include: Siemens ( OTCPK:SIEGY ) and Unilever (NYSE: UN ). Obviously this list is not all-inclusive and depending on whether you expect a weakening or strengthening economy you could favor more or less cyclical companies. Nearly every day market prognosticators try to convince investors to change their investment strategy. While it is difficult to ignore them when the market swoons that is precisely what most successful investors learn to do. It is more gratifying and ultimately more profitable to view short-term market fluctuations as random noise unless you have a compelling reason to think otherwise. Editor’s Note: This article discusses one or more securities that do not trade on a major exchange. Please be aware of the risks associated with these stocks.

Virtus To Acquire Majority Stake In ETF Platform

Founded in 2012, ETF Issuer Solutions (ETFis) is a turnkey platform available for investment manager looking to launch new exchange traded funds (ETFs), but don’t want to create and manage their own ETF infrastructure. Currently, the firm has three exchange traded funds (ETFs) on the market and seven more in registration with the Securities and Exchange Commission (SEC), all of which are, or will be, managed by external sub-advisors. All of this looked appealing to Virtus Investment Partners who yesterday announced an agreement to acquire a majority interest in the firm, in a deal expected to close in March. Active and Passive ETF Platform According to a statement from Virtus, the transaction will add to Virtus’s product lineup by improving its “manufacturing capabilities” for both active and passive ETFs. Currently, Virtus has two alternative mutual funds in registration: The Virtus Long/Short Equity Fund and the Virtus Multi-Strategy Target Return Fund, both of which had paperwork filed on January 22. ETFis will become a Virtus affiliate and continue to operate as a multi-manager ETF platform. ETFis’s co-founders Matthew B. Brown and William J. Smalley will stay on with the firm. Currently, Mr. Brown is ETFis’s head of operations and technology capabilities, and Mr. Smalley is the firm’s head of product strategy and management. Said Mr. Smalley: We developed ETF Issuer Solutions to provide a technology-driven, ETF-specific platform that offers significant cost and operational efficiencies. The partnership with Virtus gives us the resources and support to execute on our long-term vision of building a leading multi-manager ETF platform. Focus on External Sub-Advisors All of ETFis’s ETFs, including the seven yet to launch, have external sub-advisers. The firm’s current products include the InfraCap MLP ETF (NYSEARCA: AMZA ), sub-advised by Infrastructure Capital Advisors; and the BioShares Biotechnology Products ETF (NASDAQ: BBP ) and BioShares Biotechnology Clinical Trials ETF (NASDAQ: BBC ), both of which are sub-advised by LifeSci Index Partners. ETFis’s products currently in registration with the SEC include: The Newfleet Multi-Sector Unconstrained Bond ETF; The Eccles Street Event Driven Opportunities ETF; The Tuttle Tactical Management U.S. Core ETF; The InfraCap REIT Preferred ETF; and The Manna Core Equity Enhanced Dividend Stream Fund. Of these, the Newfleet Multi-Sector Unconstrained Bond ETF will be the first managed by a Virtus affiliate added to ETFis’s platform. The fund is to be sub-advised by the experienced team at Newfleet Asset Management and will “have the flexibility to capitalize on opportunities across all sectors of the bond markets.” The fund’s paperwork was filed with the SEC on January 26. Said George Aylward, Virtus CEO: There is growing interest among financial advisors and investors to use exchange-traded funds in their retail and institutional portfolios because of the tax efficiency and liquidity benefits that ETFs offer. This partnership with ETFis will expand our product capabilities and allow us to offer compelling investment strategies in an actively managed ETF format.