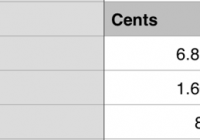
CEFL Now Yielding 23% – What’s Wrong With The Closed-End Funds?
The decline in closed-end funds has now reduced the total return on CEFL to a negative 5.2%. That decline has brought he yield on CEFL to 23% on an annualized monthly compounded basis. The decline in the closed-end funds overestimates both the possible impact that an increase in interest rates should have on the closed-end funds and the likelihood of the rate increase. The 12.9% discount to book value of the closed-end funds in the index upon which CEFL is based also makes CEFL attractive at present levels. Of the 30 index components of UBS ETRACS Monthly Pay 2xLeveraged Closed-End Fund ETN (NYSEARCA: CEFL ), 29 now pay monthly. Only the Morgan Stanley Emerging Markets Domestic Debt Fund (NYSE: EDD ) now pays quarterly dividends in January, April, October, and July. Thus, only EDD will be not included in the August 2015 CEFL monthly dividend calculation, while the 29 others will. My calculation using all the 29 components which are expected to have ex-dividend dates in July 2015 projects a August 2015 dividend of $0.2973. None of the closed-end funds in the index have changed their dividends. Thus, the decline in the CEFL monthly dividend is primarily due to the reduction in the indicative or net asset value of CEFL. The indicative value of each CEFL share has decreased about 4.5% from June 30, 2015, to July 24, 2015. Only 29 of the 30 CEFL closed-end fund components also had ex-dates in April 2015, so the May 2015 dividend was also based on 29 of the 30 components. From April 30, 2015 to July 24, 2015 the indicative or net asset value of CEFL has declined from $22.801 to $18.9324 a decline of 17.0% As I explained in MORL Dividend Drops Again In October, Now Yielding 21.5% On A Monthly Compounded Basis, if the dividends on all of the underlying components in a 2X leveraged ETN, such as CEFL, were to remain the same for a specific month, but the indicative value (aka net asset value or book value) was lower, the dividend paid, which is essentially a pass-through with no discretion by management, would also decrease by about half as much. This is the result of the rebalancing of the portfolio each month required to bring the amount of leverage back to 2X. Of course, an increase in indicative value would result in a corresponding increase in the dividend. The problem with CEFL is that the market prices of the closed-end funds in the index have declined precipitously, especially in recent weeks. The total return on CEFL from the closing price of $27.03 on January 7, 2014, the first day of trading, to the July 24, 2015 price of $18.71, taking into account the $6.915 dividends paid over that period, is now -5.2%. That does not take into consideration any income that might have been earned by reinvesting the dividends nor any losses that could have been incurred if the dividends had been reinvested in additional shares of CEFL. As recently as July 16, 2015 the total return since inception for CEFL had been positive. The decline in the prices of the 30 closed-end funds upon which CEFL is based seems to be part of the flight from all things that could be hurt by higher interest rates, which could accompany improving economic activity. In an article, X-Raying CEFL (Part 3): Interest Rate Sensitivity , published June 23, 2015, Seeking Alpha contributor Stanford Chemist presents well supported arguments as to why CEFL “is not very interest rate sensitive, and investors therefore do not have to unduly worry over the effect of increasing interest rates on CEFL.” However, at this moment, especially during the last few weeks, the markets do not seem very interested in any well supported arguments regarding the effects on closed-end funds of possibly higher interest rates. This seems to be the case even though the security that would absolutely be impacted by higher interest rates, the 10-year US treasury bond has not moved much during that period. My original interest in CEFL resulted from an attempt to benefit from my view that interest rates would remain low for a long period when many were predicting the exact opposite. I wanted to collect the high income that would result from effectively borrowing at very low short-term rates to finance higher yielding securities. The obvious choice for an investor who believes that interest rates would remain low for a long period, but cannot or does not want to take the margin call risk associated with: swaps paying floating and receiving fixed, interest rate futures or borrowing money to finance securities on margin, would be inverse floaters. Unfortunately, due to the media vilification and the persecution by regulatory agencies of financial institutions that invested in agency inverse floaters in the 1990s, I as a retail have been unable to buy any inverse floaters. See: Are mREITS The New Inverse Floaters? After not being able to find any inverse floaters, I looked for the next best thing. An inverse floater is usually an instrument that takes a pool of fixed income securities and divides it into two tranches. For example you could start with $10 million of fixed-income securities paying a 4% coupon, You would use those securities to issue $9 million floating rate securities that might pay LIBOR +1%. Then, the other $1 million would be an inverse floater that paid 31.0% – 9 x Libor. Thus if LIBOR was .25%, as it has been for the last few years. The floating rate note would pay 1.25% and the inverse floater would pay 28.75%. This would mean that the $400,000 annually paid by the $10,000,000 fixed income securities with the 4% coupon would be divided with $112,500 going the floating rate security holders and the remaining $287,500 going to the inverse floater holders. Typically, the rates would be adjusted monthly with LIBOR. Thus, the inverse floater holders are bearing the interest rate risk. The principal payments made by the $10,000,000 in fixed-income securities are passed through to the holders. Thus, the holders of the inverse floater will absolutely receive their principle back at some point. However, they bear the risk that if LIBOR interest rates rise high enough their coupon will be zero for some period. There never can be a margin call. An institution or large investor who could borrow at LIBOR + 1.0% could emulate the return on the inverse floater by buying the same $10,000,000 in fixed income securities and financing $9,000,000 it at LIBOR + 1.0%. Today, institutions can finance such securities at about LIBOR making the income from such a carry trade even more lucrative. However, a major difference between owning an inverse floater and buying the same underlying security on margin is that if the value of the underlying securities falls below a certain point, you can have a margin call. Mutual funds are not allowed to borrow more than 33% of their assets. A mutual fund that simply owned fixed-income securities and borrowed 33% would not be much of an improvement over just owning the fixed-income securities outright, after the mutual fund fees and expenses are considered. Ideally, I would have liked to find a mutual fund that owned a significant amount of inverse floaters. I still would. One investment vehicle that is not limited as to its’ borrowing and leverage in an mREIT. The Securities and Exchange Commission is not too happy with what they consider a loophole and have at times made some noise about regulating the amount of borrowing and leverage in mREITs. However, that would involve taking on the powerful real estate lobby. So action by the Securities and Exchange Commission in regard to mREIT leverage is not likely any time soon. On the surface, an mREIT that buys agency mortgage backed securities using leverage via repurchase agreements looks a lot like an inverse floater. Actually, using the example of an agency mortgage backed security with a 4.0% coupon using 9-1 leverage, since an mREIT can borrow at close to LIBOR rather than LIBOR + 1% that was assumed in the inverse floater example, its yield would even more. With LIBOR at .25%, the inverse floater would pay 28.75% while the agency mREIT would pay 37.75% less any non-interest mREIT expenses. From an investor’s viewpoint the biggest drawback in terms of agency mREITs as opposed to inverse floaters is that with agency inverse floaters you will receive the full face value at some point. Agency mREITs must mark their borrowings to market and thus will receive a margin call if the value of the underlying agency mortgage backed securities declines beyond a certain point. In an attempt to avoid the possibility of a margin call or even forced liquidation, the mREITs use various hedging strategies. I would prefer an mREIT that employed no hedging but reduced risk with less leverage. An mREIT with only 4 to 1 leverage and no hedges would have paid double-digit dividends in each of the last seven years and not have lost any share price. It would have declined in value during the taper tantrum but would have fully recovered in price and then some by today. Despite my apprehension over the fact that mREITs did not guarantee ultimate return of 100% of face value, as agency inverse floaters would, I started buying mREITs based on my view that interest rates would remain low for much longer than many market participants believed. Logically, if interest rates were to remain low, there should not be that much risk that agency mREITs would decline in value. When the UBS ETRACS Monthly Pay 2x Leveraged Mortgage REIT ETN (NYSEARCA: MORL ) was created in October 2012, it looked like an even better way to bet on my view that interest rates would remain low. MORL is structured as a note and thus circumvents the regulation that limits mutual fund leverage to only 33%. With very low borrowing costs, MORL would be paying almost twice as much in dividends than the weighted average of the mREITs that comprised the index upon which MORL is based. As long as the value in the mREITs did not decline significantly, the 2X leverage of would not be a problem. When CEFL was created it also looked like a good way to benefit from a continuation of low interest rates. CEFL, also structured as a 2X leveraged note, had the benefit of not being tied to the mortgage markets the way that MORL was and thus generating almost as high a yield while providing diversification. Later I added the ETRACS 2xLeveraged Long Wells Fargo Business Development Company ETN (NYSEARCA: BDCL ) for the same reasons. The problem is that the prices of the 30 closed-end funds upon which CEFL is based have declined. I had implicitly considered the closed-end funds to be proxies for fixed-income securities. In some respects a portfolio of 30 closed-end funds chosen by a formula that more heavily weights those with the highest yields and greatest discounts to book value seemed possibly better than ordinary bonds. However, that has not been the case. A simple portfolio of buying treasury bonds on margin, if the borrowing cost was the same low rate that CEFL implicitly uses, would have had a very good positive return from on January 7, 2014, the first day of CEFL trading to July 24, 2015. There have been numerous problems plaguing the individual closed-end funds upon which CEFL is based. Some have investments in the energy sector which have declined with oil prices. However, it seems to be fear of rising rates that has had the greatest impact. Beyond the argument that CEFL should not be very sensitive to interest rates, which the market seems to be rejecting, my view is that the market is also overestimating the probability that the Federal Reserve will be aggressive in raising rates. The most succinct way that I can express my view on the outlook for interest rates is that the Federal Reserve has many reasons not to raise rates. The economy is now showing modest growth with tepid inflation. The reason why we now have the current modest growth rates and tepid inflation as compared to negative growth and deflation is primarily due to the policy of the Federal Reserve since 2008. Over the past few years, fiscal policy has had very little impact on the economy. If anything, the reduction in federal deficits and thus fiscal thrust has been a headwind to economic growth. The Federal Reserve low rate policy is the reason why economic conditions are what they are now. It makes no sense to risk a return recession by raising rates. One of the reasons why I am still constructive on CEFL is the 12.9% weighted average discount to book value of the components that comprise the index upon which CEFL is based as of July 25, 2015. This is a relatively large increase in the discount that I measured last month of 11.1%. Three months ago CEFL had a 8.6% weighted discount to book value. Thus, in just three months the discount has increased from 8.6% to 12.9%. If the discount to book value of the components that comprise the index upon which CEFL is based was still 8.6%, the total return on CEFL since inception would still be positive. The weighted average discount is determined by taking the price-to-book value for each of the closed-end funds that comprise the index and multiplying it by the weight of each component. The sum of the products is 87.1%. None of the 30 closed-end funds in the index are currently trading at a premiums to net asset value. Last month there were two CEFL components trading at premiums. The AGIC Convertible & Income Fund II (NYSE: NCZ ) with a weight of 1.43% had a price-to-book ratio of 1.041. The AGIC Convertible & Income Fund (NYSE: NCV ) with a weight of 2.28% had a price-to-book ratio of 1.016. Now both are trading at discounts. This can be seen in the table below that shows the weight, price, net asset value, price to net asset value, ex-dividend date, dividend amount, frequency of the dividend, contribution of the component to the dividend and the amount if any of the dividend included any return of capital for each of the closed-end funds in the index. The 12.9% discount makes CEFL more attractive. The discount also makes CEFL a better investment than buying the individual securities that are included in the portfolios of the closed-end funds yourself in a margin account at 50% leverage to replicate CEFL. Even if you could borrow at less than 0.90% that the CEFL tracking fee plus the current LIBOR rate approximately equals, the discount on the CEFL components makes buying the funds rather than the individual securities a superior investment. This large discount to net asset value alone is a good reason to be constructive on CEFL. It should be noted that saying CEFL components are now trading at a deeper discount to the net asset value of the closed-end funds that comprise the index does not mean that CEFL does not always trade at a level close to its own net asset value. Since CEFL is exchangeable at the holders’ option at indicative or net asset value, its market price will not deviate significantly from the net asset value. The net asset value or indicative value of CEFL is determined by the market prices of the closed-end funds that comprise the index upon which CEFL is based. While the 2014 year-end rebalancing has reduced the monthly CEFL dividend, it is still very large. For the three months ending August 2015, the total projected dividends are $0.9769. The annualized dividends would be $3.9076. This is a 20.9% simple annualized yield with CEFL priced at $18.71. On a monthly compounded basis, the effective annualized yield is 23.0%. Aside from the fact that with a yield above 20%, even without reinvesting or compounding you get back your initial investment in only 5 years and still have your original investment shares intact, if someone thought that over the next five years markets and interest rates would remain relatively stable, and thus CEFL would continue to yield 23% on a compounded basis, the return on a strategy of reinvesting all dividends would be enormous. An investment of $100,000 would be worth $281,587 in five years. More interestingly, for those investing for future income, the income from the initial $100,000 would increase from the $23,000 initial annual rate to $64,765 annually. CEFL components as of July 24, 2015 Name Ticker Weight Price NAV price/NAV ex-div dividend frequency contribution return of capital Clough Global Opportunities Fund GLO 4.56 12.26 14.2 0.8634 7/15/2015 0.1 m 0.01408 First Trust Intermediate Duration Prf.& Income Fd FPF 4.53 21.77 24.03 0.9060 7/1/2015 0.1625 m 0.01280 Eaton Vance Tax-Managed Global Diversified Equity Income Fund EXG 4.51 9.75 10.37 0.9402 7/22/2015 0.0813 m 0.01424 0.068 Doubleline Income Solutions DSL 4.47 19.14 21.95 0.8720 7/15/2015 0.15 m 0.01326 Alpine Total Dynamic Dividend AOD 4.42 8.54 10.13 0.8430 7/22/2015 0.0575 m 0.01127 Eaton Vance Limited Duration Income Fund EVV 4.39 13.5 15.63 0.8637 7/9/2015 0.1017 m 0.01252 MFS Charter Income Trust MCR 4.35 8.28 9.69 0.8545 7/14/2015 0.0658 m 0.01310 Alpine Global Premier Properties Fund AWP 4.29 6.31 7.48 0.8436 7/22/2015 0.05 m 0.01287 0.0283 PIMCO Dynamic Credit Income Fund PCI 4.24 19.67 22.78 0.8635 7/9/2015 0.1563 m 0.01275 Blackrock Corporate High Yield Fund HYT 4.2 10.39 12.29 0.8454 7/13/2015 0.07 m 0.01071 0.0012 ING Global Equity Dividend & Premium Opportunity Fund IGD 4.19 7.93 9.05 0.8762 7/1/2015 0.076 m 0.01521 Eaton Vance Tax-Managed Diversified Equity Income Fund ETY 4.16 11.41 12.55 0.9092 7/22/2015 0.0843 m 0.01164 BlackRock International Growth and Income Trust BGY 4.15 7.19 7.75 0.9277 7/13/2015 0.049 m 0.01071 0.0337 Prudential Global Short Duration High Yield Fundd GHY 4.13 14.51 17.04 0.8515 7/15/2015 0.125 m 0.01347 Western Asset Emerging Markets Debt Fund ESD 4.07 14.46 17.51 0.8258 7/22/2015 0.105 m 0.01119 0.0268 Morgan Stanley Emerging Markets Domestic Debt Fund EDD 3.68 8.28 9.98 0.8297 6/26/2015 0.22 q GAMCO Global Gold Natural Resources & Income Trust GGN 3.6 5.28 6 0.8800 7/15/2015 0.07 m 0.01807 0.07 Prudential Short Duration High Yield Fd ISD 3.25 15.01 17.43 0.8612 7/15/2015 0.1225 m 0.01004 Aberdeen Aisa-Pacific Income Fund FAX 3.23 4.72 5.71 0.8266 7/17/2015 0.035 m 0.00907 0.0143 Calamos Global Dynamic Income Fund CHW 3.17 8.4 9.54 0.8805 7/8/2015 0.07 m 0.01000 0.0161 MFS Multimarket Income Trust MMT 2.92 6 6.97 0.8608 7/14/2015 0.0473 m 0.00871 Backstone /GSO Strategic Credit Fund BGB 2.72 15.31 17.96 0.8524 7/22/2015 0.105 m 0.00706 0.0012 Allianzgi Convertible & Income Fund NCV 2.12 7.31 7.74 0.9444 7/9/2015 0.09 m 0.00988 Western Asset High Income Fund II HIX 2.07 7.06 8.08 0.8738 7/22/2015 0.069 m 0.00766 0.0006 Blackrock Multi-Sector Income BIT 2.04 16.45 19.31 0.8519 7/13/2015 0.1167 m 0.00548 Wells Fargo Advantage Multi Sector Income Fund ERC 1.73 12.4 14.75 0.8407 7/13/2015 0.0967 m 0.00511 0.0283 Wells Fargo Advantage Income Opportunities Fund EAD 1.33 8.04 9.34 0.8608 7/13/2015 0.068 m 0.00426 Allianzgi Convertible & Income Fund II NCZ 1.33 6.69 6.9 0.9696 7/9/2015 0.085 m 0.00640 Nuveen Preferred Income Opportunities Fund JPC 1.2 9.21 10.44 0.8822 7/13/2015 0.067 m 0.00331 Invesco Dynamic Credit Opportunities Fund VTA 0.96 11.49 13.29 0.8646 7/9/2015 0.075 m 0.00237 Disclosure: I am/we are long CEFL, MORL, BDCL. (More…) I wrote this article myself, and it expresses my own opinions. I am not receiving compensation for it (other than from Seeking Alpha). I have no business relationship with any company whose stock is mentioned in this article.