Tag Archives: nysejnj

4 Healthcare ETFs To Buy As Johnson & Johnson Beats Estimates

Original Post With the Q2 earnings season kicking off, Johnson & Johnson (NYSE: JNJ ) is the first to have reported earnings in the healthcare space. The world’s biggest maker of healthcare products continued its long streak of earnings beat despite currency headwinds and revenues that came in above our estimates. Further, the company lifted its full year outlook, reflecting confidence in its future growth. Johnson & Johnson Q2 Results in Focus Earnings per share came in at $1.71, a couple of cents above the Zacks Consensus Estimate but 3.9% below the year-ago earnings. Revenues slid 8.8% year over year to $17.8 billion but edged past the Zacks Consensus Estimate of $17.7 billion. Healthy sales of new drugs including Zytiga, Invokana, Imbruvica, and Xarelto and strength of old drugs such as Stelara, Concerta, Simponi and Invega Sustenna offset a steep decline in sales of the hepatitis C medicine – Olysio – which has lost its competitive position in the U.S. to its rivals Gilead (NASDAQ: GILD ) and AbbVie (NYSE: ABBV ). In spite of the fact that a strong U.S. dollar would remain a major drag on international revenue growth, the company raised its earnings per share guidance to $6.10-$6.20 from $6.04-$6.19. The new midpoint is above the current Zacks Consensus Estimate of $6.14. Market Impact Despite the earnings beat and encouraging guidance, shares of JNJ dropped as much as 1.7% on the day but recovered slightly to close at down 0.5%. This could be an attractive entry point for value investors given that Johnson & Johnson has a solid Value Style Score of ‘B’. Further, the stock has a favorable Zacks Rank #3 (Hold) and a solid industry Rank in the top 30% at the time of writing. ETFs to Buy That being said, investors could pile up some of the top ranked healthcare ETFs having the largest allocation to this behemoth for higher returns. We have detailed four of them below. All of them have a Zacks ETF Rank of 2 or ‘Buy’ rating, suggesting that they will outperform the market in the coming months. Health Care Select Sector SPDR ETF (NYSEARCA: XLV ) The most popular healthcare ETF, XLV follows the S&P Health Care Select Sector Index. This fund manages about $15.4 billion in its asset base and trades in heavy volume of more than 9.2 million shares. Expense ratio came in at 0.15% annually. In total, the fund holds 56 securities in its basket with JNJ taking the top spot at 9.51% of the assets. Pharma accounts for 42.9% share from a sector look while biotech, healthcare providers and services, and equipment and supplies make up for a double-digit exposure each. The fund has gained about 11.7% in the year to date time frame. iShares U.S. Healthcare ETF (NYSEARCA: IYH ) This fund provides exposure to 106 securities by tracking the Dow Jones U.S. Health Care Index. Here again, Johnson & Johnson dominates the fund’s return at 9.11% of total assets. In terms of industrial exposure, pharma takes the top spot at 41%, followed by biotech (23.2%), healthcare providers & services (16.3%) and healthcare equipment & supplies (15.2%). The product has amassed nearly $2.6 billion in its asset base while it charges 44 bps in annual fees. It trades in good volume of more than 23,000 shares a day and is up 13.8% this year. iShares U.S. Pharmaceuticals ETF (NYSEARCA: IHE ) This ETF targets the pharma corner of the broad healthcare space and tracks the Dow Jones U.S. Select Pharmaceuticals Index. Holding 39 stocks in its basket, Johnson & Johnson occupies the top position at 9.11%. Pharma takes the largest share at 85.7% while biotech takes the remainder. The product has managed nearly $1.2 billion in its asset base while volume is relatively light at under 56,000 shares a day on average. The fund charges 444 bps in fees per year from investors and has surged 20.9% so far this year. Vanguard Health Care ETF (NYSEARCA: VHT ) This ETF tracks the MSCI US Investable Market Health Care 25/50 Index and holds 349 stocks in its basket. Out of these, Johnson & Johnson takes the top spot with a 7.9% allocation. Pharma takes the largest share at 36.8% while biotech and healthcare equipment round off the top three spots. VHT is also one of the popular and liquid ETFs with AUM of $6.2 billion and average daily volume of over 297,000 shares. It charges 12 bps in annual fees and expenses. The product has added 13.6% in the year to date time frame.
Best And Worst: Large Cap Blend ETFs, Mutual Funds, And Key Holdings

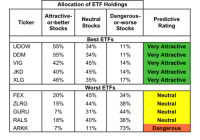
Summary Large Cap Blend style ranks second in 2Q15. Based on an aggregation of ratings of 53 ETFs and 908 mutual funds. UDOW is our top rated Large Cap Blend ETF and GQLOX is our top rated Large Cap Blend mutual fund. The Large Cap Blend style ranks second out of the 12 fund styles as detailed in our 2Q15 Style Ratings report . It gets our Attractive rating, which is based on aggregation of ratings of 53 ETFs and 908 mutual funds in the Large Cap Blend style. Figures 1 and 2 show the five best and worst rated ETFs and mutual funds in the style. Not all Large Cap Blend style ETFs and mutual funds are created the same. The number of holdings varies widely (from 15 to 1364). This variation creates drastically different investment implications and, therefore, ratings. Investors seeking exposure to the Large Cap Blend Style should buy one of the Attractive-or-better rated ETFs or mutual funds from Figures 1 and 2. Figure 1: ETFs with the Best & Worst Ratings – Top 5 (click to enlarge) * Best ETFs exclude ETFs with TNAs less than $100 million for inadequate liquidity. Arrow QVM Equity Factor ETF (NYSEARCA: QVM ) IS excluded from Figure 1 because its total net assets are below $100 million and do not meet our liquidity minimums. Figure 2: Mutual Funds with the Best & Worst Ratings – Top 5 (click to enlarge) * Best mutual funds exclude funds with TNAs less than $100 million for inadequate liquidity. ProShares UltraPro Dow30 ETF (NYSEARCA: UDOW ) is our top-rated Large Cap Blend ETF and GMO Quality Fund (MUTF: GQLOX ) is our top-rated Large Cap Blend mutual fund. Both earn a Very Attractive rating. One of our favorite stocks held by Large Cap Blend funds is Johnson & Johnson (NYSE: JNJ ). In 2014, Johnson & Johnson earned an after-tax operating profit ( NOPAT ) of almost $17 billion; its highest ever in our model. The company has been very consistent over the last decade with regard to its financial performance. NOPAT has grown by 8% compounded annually since 2004 and Johnson & Johnson’s return on invested capital (NASDAQ: ROIC ) has also remained above 14% every year over the last decade. This consistency has allowed the company to continually increase economic earnings every year over this same time frame. Despite the growth in the business, the stock is currently undervalued. At its current price of $98/share, JNJ has a price to economic book value (PEBV) ratio of 1.0. This ratio implies the market expects Johnson & Johnson’s NOPAT to never grow from current levels. Meanwhile, if Johnson & Johnson can grow NOPAT by 7% compounded annually for the next 5 years , the company is worth $140/share- a 43% upside from current levels. These expectations could be easily surpassed given the company’s long and consistent history of generating shareholder value. Ark Innovation ETF (NYSEARCA: ARKK ) is our worst-rated Large Cap Blend ETF and Lazard Enhances Opportunities Portfolio (MUTF: LEOOX ) is our worst-rated Large Cap Blend fund. ARKK earns a Dangerous rating and LEOOX earns a Very Dangerous rating. One of the worst stocks held by Large Cap Blend funds is recent Danger Zone stock Athenahealth (NASDAQ: ATHN ). Over the last three years many of the key financial metrics of the company have deteriorated. Athenahealth’s ROIC has declined from 14% in 2011 to just 1% in 2014. NOPAT has also had a very similar path, declining 42% compounded annually since 2011. In addition, for the past three years, Athenahealth’s cost of capital ( WACC ) has exceeded its ROIC. This has caused the company to earn negative economic earnings and is an indication that the company is destroying shareholder value. Athenahealth’s stock price, however, has not reflected the fundamental deterioration of its underlying business. Since going public in 2007, the stock price has more than tripled. However NOPAT for Athenahealth has declined by 50% since 2007. To justify its current price of $117/share, the company would need to grow NOPAT 60% compounded annually for the next 11 years . This seems very optimistic considering the declining business operations as described above Figures 3 and 4 show the rating landscape of all Large Cap Blend ETFs and mutual funds. Figure 3: Separating the Best ETFs From the Worst Funds (click to enlarge) Figure 4: Separating the Best Mutual Funds From the Worst Funds (click to enlarge) Sources: Figures 1-4: New Constructs, LLC and company filings D isclosure: David Trainer owns JNJ. David Trainer and Allen L. Jackson receive no compensation to write about any specific stock, style, style or theme. Disclosure: The author is long JNJ. (More…) The author wrote this article themselves, and it expresses their own opinions. The author is not receiving compensation for it. The author has no business relationship with any company whose stock is mentioned in this article.

How I Earned 17% Compound Annual Return For 6 Years

Summary Using a carefully crafted portfolio of 18 stocks, I have beat the S&P 500 for the past six years. My portfolio consists of Consumer Stocks, Utilities and Railroads. I buy stocks in small increments on pullbacks to reduce risk and increase profit. Using a carefully crafted portfolio of 18 stocks, I have achieved 17.17% compound annual return since Jan. 1, 2009. I have been investing money for 21 years, and achieved my best years from 2009 to 2014. This article will discuss why I purchased these stocks and my outlook for 2015. My strategy is first and foremost not to lose money. Cash is king. Much of the gains in recent years were from decisions that I made five and 10 years ago. I invested in consumer, utility and railroad stocks that have durability, decent profit margins and a solid future. Over the years, I tended to sell the losers and buy more of the winners. Own the best and sell the rest. Nearly all my gains were from stocks. I only added bonds to the portfolio in early 2014. My brokerage accounts at Charles Schwab have achieved 17.17% compound annual returns from Jan. 1, 2009, to Dec. 24, 2014, compared with 14.41% compound annual return for the S&P 500 over the same time period. If you look at the this chart on my personal blog, you will see my portfolio risk and return are better than a typical aggressive portfolio. Schwab says the risk or standard deviation for an Aggressive Portfolio is 15.40 and the return 15.07. My risk was lower at 11.79, and my 17.17% return was 2.1% better than an Aggressive Portfolio. Below are the securities in our largest brokerage account, which was up 17% in 2014. Name Purchase Price Price on Dec. 28, 2014 % of Portfolio My % Return YTD Return to 12/28/14 Berkshire Hathaway (NYSE: BRK.B ) 117.43 151.35 12.63 28.88% 27.66 Boston Beer Co. (NYSE: SAM ) 218.67 295.74 10.86 35.25 22.31 Canadian National Railway (NYSE: CNI ) 57.32 68.69 1.15 19.84 20.47 Church & Dwight (NYSE: CHD ) 62.14 80.18 6.96 29.03 20.97 Coca Cola (NYSE: KO ) 28.31 42.96 2.72 51.77 3.99 Colgate-Palmolive (NYSE: CL ) 63.90 70.88 0.3 10.93 8.69 ConAgra Foods (NYSE: CAG ) 23.80 36.86 0.26 54.86 9.38 Dominion Resources (NYSE: D ) 58.17 79.28 4.23 36.29 22.56 DuPont (NYSE: DD ) 45.51 75.13 0.21 65.08 15.64 Hershey (NYSE: HSY ) 97.91 106.41 1.78 8.69 9.44 JM Smucker (NYSE: SJM ) 83.77 103.39 0.86 23.41 -0.22 Johnson & Johnson (NYSE: JNJ ) 66.45 105.06 1.31 58.11 14.71 McDonalds (NYSE: MCD ) 75.50 94.78 0.24 25.54 -2.32 Norfolk Southern (NYSE: NSC ) 94.62 111.54 0.28 17.88 20.16 PepsiCo (NYSE: PEP ) 78.70 97.05 2.27 23.32 17.01 Reynolds American (NYSE: RAI ) 37.28 65.71 0.38 76.27 31.45 Union Pacific (NYSE: UNP ) 78.71 120.39 32.14 52.96 43.32 Westar Energy (NYSE: WR ) 36.10 41.87 0.7 15.98 30.15 Burlington Northern Santa Fe 3.05% Due 03/15/22 0.97 100.6348 4.2 3.35 + 3.05% coupon =6.4% N/A Burlington Northern Santa Fe 3.05% Due 09/01/22 0.99 99.9219 4.17 1.90+3.05% coupon = 4.95% N/A Union Pacific 2.75% Due 04/15/23 0.95 98.6744 4.12 4.27+2.75% coupon=7% N/A Union Pacific 2.95% Due 01/15/23 0.96 100.3483 4.19 4.32+2.95% Coupon = 7.27% N/A Cash 1.00 1.00 4.04 You can see that 16.67% of the portfolio is invested in railroad bonds. I bought my Investment Grade bonds on Feb. 3, 2014. U.S. interest rates actually fell in 2014, so my bonds appreciated. My total return on my bonds in 2014 — appreciation plus coupon — was 6.4%. Going forward, I believe my bonds will lose value, because I expect interest rates to rise in 2015. However, I am prepared for these bonds to lose up to 10%, even 20% of market value. I like the income. I plan to hold the bonds to term, so I will not lose anything. From the chart, you can see that my largest holding is Union Pacific ( UNP ) at 32.14% of my portfolio. There is some risk involved with owning so much stock in one company, but the outlook for Union Pacific, and railroads in general, is outstanding. Until that changes, I plan to hold my railroad stocks. When I was a reporter working for a local newspaper, a banker used to come up to me at public meetings and ask me to bring my car loans to him. I would always tell him that I have no car loans, my cars are paid off. One day, he came up to me at a black tie event where he interrupted me while I was talking with some friends. Like an aggressive car salesman, the banker said, “Hey Mike we just dropped our interest rates on home loans. Why don’t you bring your home loan to my bank?” I became incensed. I said, “Mr. Banker my house is paid off. I don’t have any debt. I would be happy to lend you some money if you need it.” He sheepishly walked away and never came up to me again asking for my business. The above story illustrates a point. Bankers are eager to lend money. Many people accept the easy credit and never get out of debt. They don’t benefit from America’s pro-capitalist system that favors ownership of property and businesses. If you want to get ahead in life, stop working for bankers. Make them work for you. Pay off your debts, put your money in the bank and earn interest. Become a capitalist. Own property that appreciates in value. Buy stock in companies that are going to benefit from consumers’ daily spending habits. I own several consumer stocks. My favorite is Church & Dwight ( CHD ), a consumer household products company that owns Arm & Hammer Baking Soda and Trojan condoms — stuff people need regardless of the economy. I also own Colgate-Palmolive ( CL ) , seller of pet food and toothpaste, and Reynolds American ( RAI ), a tobacco company with a history of increasing dividends. I own no biotech stocks. In 2008, I lost about 7% of my investment in Dendreon ( OTCPK:DNDNQ ) after holding it for about four months. I sold it. I also lost money on a pain management company. After these mistakes, I vowed to stay away from biotech and most health care stocks. I own Johnson & Johnson ( JNJ ) because it is so diversified, owning a lot of personal care products as well as medical supplies. I own no mutual funds in our brokerage account. I don’t want to give money to mutual fund managers, who take 1% or even 2% management fees. Cut out the management fees, and there is more money available to invest and compound over time. We own some Vanguard 500 Index Fund (MUTF: VFINX ) in an individual retirement account. Money managers have a tough time trying to beat the Index, so why not just own the index? I buy stock in increments on pullbacks to reduce risk and increase profitability. This really paid off in buying stock in Boston Beer ( SAM ), another great consumer stock. I bought SAM shares in the first nine months of 2014 at an average price of $218; the stock recently hit $288 per share, a 32% gain. My stocks and bonds provide steady income. I do not participate in dividend reinvestment plans. Cash dividends go into my accounts, where they sit in a money market fund until I can find the next deal. I have some regrets. I bought Apple (NASDAQ: AAPL ) at $14 per share in 2000 when it had $12 per share in cash. I sold it at $18 per share when iTunes was introduced. That was a huge mistake. Part of the reason I sold it was to get out of tech and stay focused on my consumer stocks, utilities and railroad stocks. Money managers can find much to criticize with my account. I have too much exposure to railroads. However, I have written about railroads for 20 years. I understand their business models. I believe there is a renaissance taking place in rail today. Railroads are four times more efficient than trucking, especially over long distances. In 2014, railroads experienced their best year since 2007. Conclusion My portfolio is not for everybody. I can handle the risk associated with my overweight positions. I expect 2015 to be a tough year to make money. If low oil prices drag down other asset classes, we could see a bear market. However, consumers are loving the 30% gas price cut. The extra money saved at the pump will likely not sit idly in their bank accounts. I expect consumers to spend more money in 2015 than they did in 2014. The U.S. economy is growing, and this bodes well for the stock market. I am prepared for a 10%, or even 20% correction. If that happens, I will not sell stocks, I will look for opportunities to buy quality assets on the cheap. Editor’s Note: This article covers one or more stocks trading at less than $1 per share and/or with less than a $100 million market cap. Please be aware of the risks associated with these stocks.