Tag Archives: nysefdx

Best And Worst Q3’15: Industrials ETFs, Mutual Funds And Key Holdings

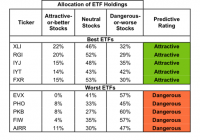
Summary Industrials sector ranks third in Q3’15. Based on an aggregation of ratings of 19 ETFs and 17 mutual funds. XLI is our top-rated Industrials ETF and FSRFX is our top-rated Industrials mutual fund. The Industrials sector ranks third out of the 10 sectors as detailed in our Q3’15 Sector Ratings for ETFs and Mutual Funds report. It gets our Neutral rating, which is based on aggregation of ratings of 19 ETFs and 17 mutual funds in the Industrials sector. See a recap of our Q2’15 Sector Ratings here. Figures 1 and 2 show the five best and worst-rated ETFs and mutual funds in the sector. Not all Industrials sector ETFs and mutual funds are created the same. The number of holdings varies widely (from 20 to 347). This variation creates drastically different investment implications and, therefore, ratings. Investors seeking exposure to the Industrials sector should buy one of the Attractive-or-better rated ETFs or mutual funds from Figures 1 and 2. Figure 1: ETFs with the Best & Worst Ratings – Top 5 (click to enlarge) * Best ETFs exclude ETFs with TNAs less than $100 million for inadequate liquidity. Sources: New Constructs, LLC and company filings Figure 2: Mutual Funds with the Best & Worst Ratings – Top 5 (click to enlarge) * Best mutual funds exclude funds with TNAs less than $100 million for inadequate liquidity. Sources: New Constructs, LLC and company filings The Fidelity Select Environment and Alt Energy Portfolio (MUTF: FSLEX ) and the Rydex Transportation Fund (MUTF: RYPIX ) (MUTF: RYPAX ) are excluded from Figure 2 because their total net assets are below $100 million and do not meet our liquidity minimums. The Industrial Select Sector SPDR ETF (NYSEARCA: XLI ) is the top-rated Industrials ETF and the Fidelity Select Transportation (MUTF: FSRFX ) is the top-rated Industrials mutual fund. Both earn an Attractive rating. The First Trust RBA American Industrial Renaissance ETF (NASDAQ: AIRR ) is the worst-rated Industrials ETF and the ICON Industrials Fund (MUTF: ICIAX ) is the worst-rated Industrials mutual fund. Both earn a Dangerous rating. 418 stocks of the 3000+ we cover are classified as Industrials stocks. Deere & Company (NYSE: DE ) is one of our favorite stocks held by Industrials ETFs and mutual funds and earns our Attractive Rating. Since 2008 the company has grown after-tax profit (NOPAT) by 8% compounded annually. Deere currently generates a top-quintile return on invested capital ( ROIC ) of 16%. Falling agriculture prices have brought Deere’s stock price down over the past year, and we think this drop gives long-term investors an excellent buying opportunity. At its current price of $92/share, Deere has a price to economic book value ( PEBV ) ratio of 0.6. This ratio implies the market expects Deere’s profits to permanently decline by 40%. This expectation seems unduly low and likely reflects a market overreaction to issues and a failure to recognize the leading position Deere holds in the agriculture industry. Deere currently has an economic book value , or no growth value of $153/share – a 66% upside. FedEx Corporation (NYSE: FDX ) is one of our least favorite stocks held by Industrials ETFs and mutual funds and earns our Very Dangerous rating. Since 2007 the company has only been able to grow NOPAT by 1% compounded annually. Over the same time frame, ROIC has fallen from 9% to 6% and NOPBT margins have fallen from 11% to 9%. When generating over $40 billion in revenue, a 200 basis point decline in margin greatly affects FedEx’s profitability. Despite these fundamental issues, the risk in the stock’s high valuation should give investors pause. To justify its current price of ~$170/share, FedEx must grow NOPAT by 10% for the next 24 years . Expecting the company to increase its NOPAT growth rate tenfold and maintain that rate for 24 years after years of lackluster NOPAT growth seems risky. Figures 3 and 4 show the rating landscape of all Industrials ETFs and mutual funds. Figure 3: Separating the Best ETFs From the Worst ETFs (click to enlarge) Sources: New Constructs, LLC and company filings Figure 4: Separating the Best Mutual Funds From the Worst Mutual Funds (click to enlarge) Sources: New Constructs, LLC and company filings D isclosure: David Trainer and Max Lee receive no compensation to write about any specific stock, sector or theme. Disclosure: I/we have no positions in any stocks mentioned, and no plans to initiate any positions within the next 72 hours. (More…) I wrote this article myself, and it expresses my own opinions. I am not receiving compensation for it. I have no business relationship with any company whose stock is mentioned in this article.

Will FedEx’s Q4 Spell More Trouble For Transport ETFs?

The transportation sector has given an ugly performance this year in spite of a strengthening economy, better job conditions and cheap fuel. The major culprit is the strong dollar, which is eroding the profitability of big transporters. The rough trading is expected to continue for the sector in the months ahead, especially after a disappointing fourth quarter 2015 earnings report from bellwether FedEx (NYSE: FDX ). The courier company lagged our estimates on revenues and earnings and guided lower, dampening investors’ mood. However, the numbers were better than the year-ago quarters. Q4 FedEx Results in Detail Earnings per share climbed 4.7% year over year to $2.66 but missed the Zacks Consensus Estimate by four cents. Revenues rose 2.5% year over year to $12.1 billion but fell shy of our estimate of $12.39 billion owing to negative currency translation and lower fuel surcharges. FedEx’s ongoing three-year cost cutting measures in the FedEx Express unit, which started in late 2012, are largely paying off and are expected to continue doing so in the coming quarters. This profit-improvement plan will continue to boost revenue and profitability. However, a strong dollar and lower fuel surcharges will likely keep on hurting the company’s profitability in fiscal 2016. As a result, the second largest U.S. package delivery company provided fiscal 2016 earnings per share guidance of $10.60-$11.10, the midpoint of which is below the Zacks Consensus Estimate of $10.90. Investors should note that FedEx is in the process of acquiring the Dutch parcel-delivery company TNT Express ( OTCPK:TNTEY ) for €4.4 billion ($4.8 billion). The buyout is expected to close in the first half of calendar year 2016. The acquisition, pending European regulatory approvals, would bolster its global footprint, particularly in the European markets with many untapped nations like the UK and France. The deal would create the third-largest delivery company in Europe after United Parcel Service (NYSE: UPS ) and Deutsche Post ( OTCPK:DPSGY ). Hence, the transaction will give a big boost to the company’s competitive position and future growth story. That being said, FedEX has a solid Growth Style Score of ‘A’ with some flavor of value as it also has a Value Style Score of ‘B’. Further, the stock has a favorable Zacks Rank #3 (Hold) and a solid industry Rank in the top 43% at the time of writing. Market Impact FDX shares dropped as much as 3.3% in yesterday’s trading session following disappointing results on elevated volumes of nearly 2.5 times than the average. This represents the biggest one-day fall so far this year. Given this, many investors may want to tap the beaten down price of FDX by considering either of the following ETFs: iShares Transportation Average ETF (NYSEARCA: IYT ) The ETF tracks the Dow Jones Transportation Average Index, giving investors exposure to the small basket of 20 securities. Out of these, FedEx occupies the top position in the basket with 13.5% of assets. Within the transportation sector, railroad takes the top spot with 46.8% share in the basket while air freight and logistics (30.1%), and airlines (15.2%) round off the top three. The fund has accumulated nearly $870 million in AUM while it sees good trading volume of around 438,000 shares a day. It charges 43 bps in fees per year from investors and lost 0.3% on the day following the earnings results. The product is down 8.3% in the year-to-date time frame and has a Zacks ETF Rank of 3 or ‘Hold’ rating with a High risk outlook. SPDR S&P Transportation ETF (NYSEARCA: XTN ) This fund follows the S&P Transportation Select Industry Index and uses almost an equal weight methodology for each security. Holding 50 stocks with AUM of $399.2 million, FedEx takes the fourth spot with a 2.7% share in the basket. The product is heavily exposed to trucking which accounts for 36.2% of total assets while airlines make up for another one-fourth share. Airfreight & logistics, and railroads account for 22.7% and 11% share, respectively. The fund charges 35 bps in fees per year from investors and trades in a moderate volume of about 83,000 shares a day. XTN was down 0.6% at the close after FedEx earnings were released and 8.5% so far in the year. The fund has a Zacks ETF Rank of 1 or ‘Strong Buy’ rating with a High risk outlook. Original Post

Transport ETFs Jolted By Weak UPS Earnings Forecast

With the economy growing at the fastest clip in over a decade and the oil price at a five-year low, transportation was one of the best performing sectors of 2014. This trend continued in 2015 driven by solid retail, manufacturing, and labor data that created strong demand for the movement of goods across many economic sectors. Additionally, strong earnings from major players in the industry are fueling growth in the sector. However, the space was badly hit by the recent profit warning and sluggish outlook from the bellwether United Parcel Service (NYSE: UPS ) on January 23 that dampened investors’ mood making them cautious on the stock and the broad sector. UPS Warns of Soft Q4 Earnings The world’s largest package delivery company said that higher operating expenses and temporary hiring for the peak holiday season might take a toll on the earnings for the fourth quarter and full-year 2014. It is slated to release its fourth quarter earnings on February 3. The company now projects earnings for Q4 to come in at $1.25 per share, missing the Wall Street’s expectations of $1.47. Accordingly, the Zacks Consensus Estimate moved down to $1.25 from $1.47 over a period of seven days. United Parcel also slashed its full-year guidance to $4.75 per share, much below the previous expectation of $4.90-$5.00 a share and the current Zacks Consensus Estimate of $4.77. The Zacks Consensus Estimate has declined 21 cents over the past 7 days. Weak 2015 Guidance Further, the company expects 2015 earnings to grow slightly less than its long-term growth target of 9-13% due to increased pension costs and currency headwinds. The Zacks Consensus Estimate currently represents growth of 7.85% for this year. Market Impact The news has spread bearishness not only on this package delivery giant but also on the broad space. UPS shares dropped as much as 10% on Friday after this bearish announcement and are down nearly 11.7% over the past three days. Its major rival FedEx (NYSE: FDX ) fell 4.1% over the past three sessions. The sluggish trading has also been felt in the ETF world as both the transport ETFs – the iShares Dow Jones Transportation Average Fund (NYSEARCA: IYT ) and the SPDR S&P Transportation ETF (NYSEARCA: XTN ) – lost 2.3% and 1.2%, respectively, in the same period. What Lies Ahead? Despite the slide and UPS’ sluggish outlook, investors shouldn’t completely write off transportation ETFs from their holdings. This is because the funds have spread out exposure to a number of firms in various types of industries like railroads, airline and low cost trucking suggesting that the space can easily counter shocks from some of the industry’s biggest components. In fact, IYT puts about 47% in railroads while airfreight & logistics makes up for nearly 27% share. Meanwhile, XTN is heavily exposed to trucking and airlines as these make up roughly 62% of the total while air freight & logistics accounts for 21% share. In terms of individual holdings, the iShares product is heavily concentrated on the top firm – FedEx – at 11.65% while UPS takes the fourth spot at 6.71%. On the other hand, State Street fund uses an equal weight methodology for each security. While IYT is more popular and liquid among the two, XTN is cheap by 8 bps. Further, FedEx reaffirmed its EPS guidance of $8.50-$9.00 for fiscal 2015 on the heels of UPS’ warnings. The midpoint is well above the Zacks Consensus Estimate of $8.94, indicating sound business for the transport ETFs. If these were not enough, cheap fuel will provide a big-time boost to transport earnings growth. This has already started to reflect in the latest earnings results as earnings for the transport sector reported so far is up 20.6% with a beat ratio of 57.1% and median surprise of 3.3%.