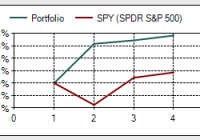
I am an indexer who completely understands that most professionals and most retail investors do not match the simple long term market index gains available. Benchmarking is important even for those with lower risk balanced portfolios. I have been correcting my Canadian home bias by dollar cost averaging portfolio income into U.S. holdings, that is starting to pay off. In 2014, ironically it was my 5 individual stock picks that carried the day for this indexer. 2014 was a very solid year for the stock markets and a very solid year for those with balanced portfolios. In fact, many investors with balanced portfolios were able to obtain near market gains, or market beating gains with much lower volatility. Based on risk adjusted returns, 2014 was certainly the year of the balanced portfolio. In 2014 and according to low-risk-investing.com the U.S. markets (NYSEARCA: SPY ) delivered 13.5%, a broad based bond index (NYSEARCA: AGG ) delivered 6%, long term Treasuries (NYSEARCA: TLT ) delivered 27.3%, International Markets (NYSEARCA: EFA ) delivered -6.2% and the Canadian Markets (NYSEARCA: EWC ) delivered 1.1%. Most of the poor results in the Canadian and International holdings for US investors were courtesy of the very strong US dollar. The Canadian markets (TSX capped composite) actually delivered 7.4% to a Canadian in 2014 according to Standard and Poor’s. On the dividend growth front the dividend aristocrats (NYSEARCA: NOBL ) delivered 15.6% while the Dividend Achievers (NYSEARCA: VIG ) delivered 9.5% in 2014. Higher yielders (NYSEARCA: VYM ) delivered 13.5%. A simple balanced portfolio with 66.6% SPY and 33.3% comprised of AGG and TLT would have delivered a very healthy 14.5% in 2014. A 50/50 stock to bond portfolio of same parts would have delivered 15.1% in 2014, and that’s with a portfolio of a volatility level of 4.8% compared to 8.2% based on the beta metrics applied on low-risk-investing.com. TLT delivered on so many fronts in 2014. I often suggest that readers consider TLT as portfolio insurance as long term treasuries often offer an inverse relationship to the equity markets in modest to severe market corrections. Here’s my article , “The Best Market Correction Insurance”. Certainly not many would have predicted that TLT would beat the pants off of the equity markets in 2014 but that was the case. I suggest TLT for periods such as this example when the markets were throwing a little tantrum. Here’s TLT vs. SPY from January 1 of 2014 to March 30 2014. The x axis represents months in duration, the y axis represents returns. TLT is in racing green. The markets are skittish, and TLT delivered in 2014 even in the most minor of corrections. TLT finished the year very strong as oil price concerns added some uncertainty. In 2014 I put my Cranky Maneuver into play with respect to our discount brokerage accounts at TD Waterhouse. For context, this investment story begins in the early to mid part of the 2000s when my approach involved a combination of ETFs and a few individual company holdings. I did very well approaching and moving through the market correction, yes I beat the broad market indices by a very large degree by buying when markets corrected and by taking on even more risk by investing in small cap and higher risk sectors such as materials and developing markets. I was also lucky enough to invest in one of Canada’s best managed funds ever – Sprott Canadian Equity. I was also lucky enough to make a mistake and have a terrible Canadian home bias. Canadian markets did very well in the last decade for U.S. 2000-2009. I was also lucky enough to have Barrick Gold (NYSE: ABX ) as a client at the time, and as I was hanging around with and befriending gold bugs they encouraged me to buy a healthy allotment of gold investments. I sold out of those toward the top of the gold price trend. Here’s Barrick from early 2002 to year end 2011. (click to enlarge) When all was said and done, I found myself with meaningful monies (well at least to me) moving out of the recession. I quickly, and early in the recovery, began moving to a more balanced approached to protect those gains. I will admit that my very conservative approach has left some money on the table if I consider the market gains that have been available from 2011. But my goal was to protect assets and create a very low volatility portfolio. Even entering 2014 our discount brokerage accounts were in the area of only 30-40% equities, and they entered the year with a still pronounced Canadian home bias (not enough US or International exposure). The portfolios displayed a very crazy low beta of .2 through any market turbulence in the years approaching 2014. In retrospect I was too conservative, especially considering that I had displayed a very high risk tolerance level through the market corrections of 2000 and the Great Recession. That said, my goal for 2014 was to ‘fix’ my home bias on the fly by investing all portfolio income into the US holdings. That strategy was designed to perform 2 functions, it would increase my equity exposure and growth potential, and it would also gradually increase my US exposure. It is also an interesting risk management tool or strategy. In rising equity markets the portfolio is obviously increasing in value while the volatility level also increases with that added equity exposure. Two measures are increasing the equity component, new monies put into the equities and those rising equity prices. The risk is managed by way of that higher portfolio value. I can look at my portfolio and say that based on historical performance of certain stock to bond allocations, my portfolio value might only drop by 15% in a 50% stock market correction. If a portfolio value went from $220,000 to $250,000 in the year and that $250,000 portfolio might potentially only fall to $212,500 in a severe correction – that draw down might be easy to stomach. The increased risk is managed by a rising portfolio value. In 2014 I was able to move the brokerage accounts to the area of 50% equities – I am happy to play this market scenario down the middle. The portfolios are set up to protect capital and they are also set up to take advantage of any real market correction that might occur. Based on the teachings of Benjamin Graham I am more than willing to move my portfolio back to 75% equities or more if ‘normal’ valuations ever return. I would or will even borrow $250,000 to invest in equities if a real opportunity presents itself. OK, to the returns for this Scaredy Cat investor. Our discount brokerage accounts offered returns in the area of 8.4% to 21% based on the return calculation function on TD Waterhouse accounts. With the best news first here’s the chart for that best performing account. Here are the returns for calendar year 2014 at 20.6%. What’s of interest in that chart is the currency adjusted benchmark of the S&P 500, it shows returns above 20% for Canadian investors. (click to enlarge) We can see that the healthy returns in this account are related to an event in August of 2014, and that event was the purchase of Tim Hortons (THI) by Burger King (BKW). I sold out all of my Tim Hortons at silly profits. As you may know Tim Hortons is the only individual pick that I hold “on purpose”. I knew the company well having been a creative director of the business back in the day when they were originally spun off from Wendy’s (NASDAQ: WEN ) in 2007; then I was a buyer. As I wrote in this article selling all of my Tim’s was a no brainer, I then put some of the profits into Berkshire Hathaway (NYSE: BRK.B ). From September of 2014 BRK.B also had a healthy beat of the market delivering a 9.4% return compared to 3.5% for SPY according to low-risk-investing.com. This Canuck of course also had an additional currency boost included in those BRK.B dollars thanks to the U.S. dollar. Do I wish I had put all of my Tims’ profits into BRK.B? Yes. And here are the returns for one of our other discount brokerage accounts. (click to enlarge) Solid returns for a very low beta portfolio, but I certainly paid for my Canadian home bias. I would have been in better shape to cut the Canadian cord and move to a more sensible US and international equity exposure at the end of 2013. But I have no regrets having recognized my ‘mistake’. I openly admit to fixing my mistakes on the fly. Sometimes your mistakes pay off (the lost decade for me) and sometimes they don’t. But the key might be that benchmarking allows you to recognize your shortcomings and fix your portfolio. So why do I think I underperformed the benchmark in that account when my incredibly low beta portfolio beat the Canadian Stock Market Benchmark? Because of this chart showing the returns for the Tangerine Portfolios. The returns are for the calendar year 2014. (click to enlarge) I would consider the Tangerine Portfolios a benchmark. They are comprised of the market indices of Canada, U.S., International along with a broad base Canadian bond index. The portfolios are rebalanced. Most of our new monies are invested into the Tangerine Balanced Portfolio in a Tax Free and RSP (Retirement Savings Plan). The Balanced Income Portfolio holds 70% bonds, the Balanced Portfolio holds 40% bonds. I have similar returns (to the 8.39% annual) in our third major discount brokerage account, but those returns were aided by the three individual stock holdings of Enbridge (NYSE: ENB ), TransCanada (NYSE: TRP ) and Apple ( AAPL ) all of which outperformed the Canadian and U.S. market indices. Apple was added in June – let’s call that a company I hold on purpose as a growth candidate. Enbridge and TransCanada are simply companies that I could not bring myself to sell when I made the switch to indexing. Apple was purchased with the same reasoning that was behind the Tim Hortons purchase – it is a company with incredible sales and profit growth and is one of the strongest brands on the planet. As a still recovering Ad Guy I don’t mind using brand strength as a guideline for a stock pick or two (I allow myself to have a little fun when investing) and I hope that Apple turns out to be as profitable as the Tim Hortons venture. So far, so good. Here’s Enbridge and TransCanada combined total return vs. SPY over the last 10 years, courtesy of low-risk-investing.com. The time horizon is January 1, 2005 to December 31, 2014. Those two dividend challengers can stay around as long as they like – but I don’t pay them much attention. All combined, our 3 major discount brokerage accounts delivered just over 11% in 2014. Of course on a risk-adjusted return evaluation that’s more than good. I beat the Canadian index with portfolios that started year with beta(s) in the area of .2. But I did give up some gains with that tardy rebalancing. I would estimate that it cost me several thousand dollars. It’s best to use benchmarking to identify weakness and put those mistakes into dollars and cents and then extrapolate those lost returns into the future. We should know the cost of our mistakes and underperformance. Moving forward I plan to continue to invest new monies into the Tangerine Balanced Portfolio, and all portfolio income in the discount brokerage accounts will be invested into U.S. equities. It’s possible that if there is a major drop in the Canadian markets some portfolio income (in the name of rebalancing) will be redirected to Canadian ETFs. Energy is certainly taking its toll on Canadian energy companies and potentially the Canadian economy. My “Learnings” Moving to eliminate my Canadian home bias was a common sense decision. A tardy rebalancing approach led to two self-directed portfolios underperforming their assigned benchmark. The non-thinking Tangerine Balanced Portfolio continues to teach me lessons that I do not always respond to. I am comfortable making a stock selection or three. A future article will explore that strategy of holding a market index as a core and then confining a few stock selections to what an investor actually knows quite well. If one is going to be a “stock picker” perhaps there is value in buying fewer companies; but companies that an investor can hold with extreme confidence. Thanks for reading, happy benchmarking, be careful out there and always know your risk tolerance level. And I’ll add “Got International?”.