Tag Archives: nysecat

Thinking And Worrying Are Not The Same Thing!

Skeptical investors usually do well, cynics do not. A high market capitalization to GDP ratio indicates capital inefficiency. Bond markets are becoming increasingly dangerous. A cynic is someone who is negative ahead of the evidence and will who only, if ever, grudgingly admit to reality. Financial markets have always been afflicted by cynical perma-bears and detractors who simply refuse to acknowledge the power of the market’s relentless upward drift in equity prices over the past two centuries. The data is unassailable. The prophets of doom are ever ready to announce the imminent collapse of the entire financial system and predict that yes, this time is truly different! In other words, they want to short civilization- a view perhaps best expressed by selling all financial assets and hoarding real property such as gold (NYSEARCA: GLD ) . Personally, I subscribe to a more optimistic Whig historiography, which while conceding setbacks, believes in the inexorable march of progress. The most fundamental aspect of successful investing is to recognize that more wealth has been created by investing in evolution and growth than has been saved by preparing for Judgment Day. However, I am paid to worry and to question my chief premises. That is my job. The U.S. equity market has had a great five-year Bull Run, but there are now clear signs of exhaustion. Maybe today’s lofty equity prices are indeed just a reflection of a highly manipulated monetary system and are due for a big correction. Is it wise to reduce exposure now that both U.S. and European equities seem to have broken out on the upside? Here are some facts: S&P 500 company year over year sales growth was 3.1% in 2014 and is forecast to decline by .2% in 2015. More troubling, year over year earnings growth looks set to rise by just 2.4% in 2015 after a 7.2% rise in 2014. Of course, the energy sector is pushing estimates down, but even some of 2014’s best performing sectors such as Heath Care (XLV ) and Utilities (XLU ) , are forecast to have big percentage earnings declines, although profit margins seem set to remain at near record highs. As always, it is certainly possible that estimates get revised up or down as 2015 plays out. Everyone knows the S&P 500 Index has doubled in price over the past five years, yet U.S. real GDP has only grown by a cumulative 12% during the same period. Admittedly, the S&P 500 index is more than a reflection of the U.S. economy, but world GDP has only grown by only 15% since 2009, not outpacing the U.S. by any noticeable margin. The much-maligned market capitalization to U.S. GDP ratio now stands at 124% – meaning that the S&P 500 is collectively worth more than all the output of the U.S. economy. An illustrative equivalence may be in order here. Individually, many companies have a single year sales or revenues far in excess of their capital. For example, Caterpillar (NYSE: CAT ) had 2013 revenues of $56bn with capital of $21bn. Similarly, Apple (NASDAQ: AAPL ) had $183bn in sales on $112bn of capital in its latest annual report. In other words, it’s reasonable to assume that one-year sales exceed capital for many companies, yet overall capital exceeds sales for the entire S&P 500! One must wonder why so much capital is needed in aggregate to produce so little in sales. The TMC or Total Market Cap to GDP ratio is tainted by the largest banks such as JP Morgan Chase (NYSE: JPM ) , which held $211bn of equity in 2013 to generate just $96bn is sales. Now I understand that JPM and the other banks are forced to hold much more capital that they would like to in an ideal post-2008 world. Regardless of the reasons, it is fair to conclude that the S&P 500 is too highly capitalized, in aggregate, given the sales and earnings metrics of its constituent companies in relation to overall capitalization. It simply means that on average, the return on one unit of capital will be less than if the capital was more prudently deployed. The current situation can only resolve itself in one of the five ways listed here: Sales and earnings grow at a much faster pace than forecast Companies decrease capital by increasing dividends and share buybacks There is a sudden burst in productivity, allowing companies to extract greater units of earnings from the current stock of capital The overall equity market sells off Nothing changes and GDP eventually catches up with the market cap of the S&P 500 (NYSEARCA: SPY ) I am not in the habit of making bold predictions. Each of the five outcomes listed above are possible, but the last two options, a market sell-off or no change, requires the least amount effort to succeed in bringing the TMC ratio back to a more sustainable level. The main fault with my argument here and indeed with many notions about lofty valuations needing to decline is that equities, even U.S equities, offer compelling value on a relative basis compared to bonds. At a multiple of 20x, the S&P 500 offers an earnings yield of 5% and when coupled with the dividend yield of 2%, offers investors an expected return of around 7%. That compares favorably with U.S. 10y government bonds that now offer about 2.10%. Regrettably, investors cannot spend expected returns and must wait for real returns to materialize. Nonetheless, bonds, as an asset class, are becoming increasingly dangerous. Little noticed during this past month was the doubling of Japanese 10y yields from 20 bp to 40 bp. Sure, Japan’s yields are still extraordinarily low, as are yields in Germany, the UK and, of course, here in the U.S. Volatility in the bond markets is on the rise too. See (CBOE: VXTYN). If U.S 10y government bond yields were to double from 2.10% to 4.20%, admittedly a very low probability scenario, investors would be looking at a near 18 full point loss on their holdings (200 bp * modified duration of ~9). Now I know active traders would never remain idle in the face of such a selloff, however, many passive investors, housed deep inside index funds, will see real losses mount as bond yields rise. So I think it too soon to underweight U.S. equities for the simple reason that there is nothing worth over weighting right now. Holding a reasonably diversified portfolio, suited to an investor’s goals and risk preferences, remains the best means to build real wealth and avoid the pitfalls of over-reacting to high valuations and volatility. Expanding the investable universe, both in geographic and asset class terms, will enhance a portfolio’s risk and return characteristics. Diogenes of Sinope is credited with being the world’s first great cynic. He famously said, “I am Diogenes the Dog. I nuzzle the kind, bark at the greedy and bite scoundrels.” According to legend, he carried a lamp by day in his cynical search for an honest man. Today, investors are hunting for decent returns while hoping to avoid catastrophic draw downs. That is a job for a skeptical optimist, not a scoffer of the most ordinary kind. What about the search for an honest man? I am convinced they do exist. You just need to know where to look. Disclosure: The author is long SPY. (More…) The author wrote this article themselves, and it expresses their own opinions. The author is not receiving compensation for it. The author has no business relationship with any company whose stock is mentioned in this article.
11 Stocks Plus Cash Saw $24,000 Grow To Over $1 Million

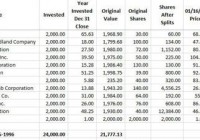
Summary Start in 1985 with a $2,000 investment in cash. Make one $2,000 investment at the end of the year from 1986 through 1996. Investments are assumed to be made in an IRA to shelter from taxes. The first $2,000 was invested in cash to pay for commissions and other fees. The average investor can save a tidy sum for retirement. It takes some luck, perseverance, and a buy and hold approach. The portfolio constructed would generate $22,400 in dividends for 2015. The portfolio was constructed by entering stock symbols into a spreadsheet in random order. The model assumed a $2,000 a year investment from 1985 through 1996 or 12 years. The first – year investment of $2,000 was invested in cash to account for commissions and other fees. The results are not actual results, but hypothetical results. Dividends that would have been earned on investments have been ignored or assumed to have been invested in stocks that blew up and went to zero ($0.00). The results generated most likely are influenced by a survivor basis. Nevertheless, the exercise proved useful. Data was obtained from company websites and or Yahoo Finance. The performance results are handicapped by not accounting for dividends paid since purchase nor assuming they are reinvested. The portfolio results presented are conservative to consider a worst case rather than an unrealistic best case. This is part one. The second part will cover the years 1998 through 2014. The model portfolio is shown below. (click to enlarge) Chart of the stock performance since inclusion into the model portfolio is shown below. Kellogg (NYSE: K ) K data by YCharts Archer Daniels Midland (NYSE: ADM ) ADM data by YCharts Starbucks (NASDAQ: SBUX ) SBUX data by YCharts The Home Depot (NYSE: HD ) HD data by YCharts Exxon Mobil (NYSE: XOM ) XOM data by YCharts Stryker (NYSE: SYK ) SYK data by YCharts Caterpillar (NYSE: CAT ) CAT data by YCharts Charles Schwab (NYSE: SCHW ) SCHW data by YCharts JPMorgan (NYSE: JPM ) JPM data by YCharts Wal-Mart (NYSE: WMT ) WMT data by YCharts Microsoft (NASDAQ: MSFT ) MSFT data by YCharts Bottom line: With a little luck and experience, it is possible for a modest investment to grow into a nice nest egg. What do you think? Disclosure: The author is long ADM, SYK, SCHW, JPM, MSFT. (More…) The author wrote this article themselves, and it expresses their own opinions. The author is not receiving compensation for it (other than from Seeking Alpha). The author has no business relationship with any company whose stock is mentioned in this article. Are you Bullish or Bearish on ? Bullish Bearish Neutral Results for ( ) Thanks for sharing your thoughts. Submit & View Results Skip to results » Share this article with a colleague

Consider This Before You Sell On Fears Of A Strong Dollar

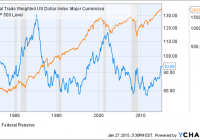
Markets tumbled Tuesday on a number of weak earnings reports. The strong U.S. dollar was a major culprit. Historically, currency changes are not a good predictor of subsequent stock market returns. Investors may wish to consider rebalancing their portfolios, but there is little evidence to suggest a major change in strategy is warranted. Markets had a turbulent Tuesday with earnings reports from firms like Microsoft (NASDAQ: MSFT ), Caterpillar (NYSE: CAT ) and Procter & Gamble (NYSE: PG ) stoking fears that economic growth is slowing. However, a more critical look into these reports suggests that strength in the U.S. dollar is a major culprit. For example, Procter & Gamble reported core earnings of $1.06 versus $1.15 in the previous year, a reduction of nearly 8%. But looking closer net sales were down 4% nearly mirroring a five percentage point impact from foreign exchange. In fact, adjusting for the effects of foreign exchange, volumes were flat (Table 1). While flat growth may be little reason to cheer, it also seems to be scant reason to overreact. As an investor before you react to currency headwinds it is logical to evaluate the effect of a stronger dollar in its historical context. Table 1: P&G’s Net Sales Drivers Oct. – Dec. 2014 Net Sales Drivers Volume Foreign Exchange Price Mix Other* Net Sales Organic Volume Organic Sales Beauty, Hair & Personal Care -2% -4% 1% 0% -1% -6% -2% -1% Grooming -2% -7% 4% 0% 0% -5% -2% 2% Health Care -2% -4% 0% 3% 0% -3% -2% 1% Fabric Care and Home Care 2% -6% 1% 0% -1% -4% 2% 4% Baby, Feminine and Family Care 0% -6% 1% 3% 0% -2% 0% 4% Total P&G 0% -5% 1% 1% -1% -4% 0% 2% *Other includes the sales mix impact of acquisitions/divestitures and rounding impacts necessary to reconcile volume to net sales. Source: Procter and Gamble Earnings Press Release. The stock market is volatile, but so are currencies. Over the past thirty years the dollar has waxed and waned against a basket of foreign currencies (Figure 1). Sometimes the U.S. dollar and the market move upward in lock step, while other times they diverge. Figure 1: The U.S. Dollar vs. The S&P 500 (click to enlarge) Do you see a correlation between the two? I do not and incidentally neither does Excel. The correlation between the dollar index and the S&P 500 (NYSEARCA: SPY ) is -0.211, most likely any correlation is simply an artifact of the dollar being in general more weak over the past ten years while the market has moved up over time. How about if we think about the situation in a different way? What if a rising dollar is associated with subsequent poor performance in the stock market? In other words, since P&G’s last earnings report stemmed from changes in the exchange rate over the past six months what if there was a correlation between the six month appreciation or depreciation of the dollar and subsequent returns in the stock market? These numbers are very easily manipulated in Excel and the correlation between six month past currency moves and three month forward stock market returns is -0.043. There is almost no correlation between the two. To further emphasize the point I created a scatterplot of the two data sets (Figure 2). The R squared of least squares regression is 0.00186, indicating no correlation. Figure 2: Three Month Subsequent S&P 500 Return Vs. Six Month Prior Appreciation in the U.S. Dollar (click to enlarge) Intuitively, this finding makes a great deal of economic sense. Currency moves are a zero sum game. If the dollar goes down against the Euro then U.S. exports are cheaper for Europeans and the reverse is true for imports. While U.S. companies on the whole may suffer because they sell abroad an appreciating dollar also makes assets denominated in dollars more attractive to foreign investors. In aggregate there is little reason to bet on the dollar causing the U.S. market to move up or down. Some market pundits are calling for a correction or worse in the stock market, however, there is no historical evidence to suggest that strength in the U.S. dollar should be correlated with stock market corrections. The S&P 500 closed at 2029 today, about 3% off its all-time intraday high of 2093. While market prognosticators constantly pitch timing the market, moves of less than 10% are impossible to time accurately. By the time the market opened today we were already down 3% from all-time highs. What if the market goes down a total of 10%? First consider that it is only after a move higher that you would know to reenter the market. Then consider that it is equally likely the market’s next move will be up. In a nutshell this explains why timing short-term corrections is a waste of time and money, although investors never seem to learn that this is the case. At the moment currency changes are still rippling through the market. One way to rebalance your portfolio would be to favor domestic stocks that capitalize on cheaper imports and sell their products within the United States. Foreign stocks that are exporters should benefit from the opposite trend and allow for a portfolio that is still balanced between foreign and U.S. based corporations. For example, some U.S. based companies that should see stronger earnings as the result of dollar appreciation are: AutoNation (NYSE: AN ), Costco (NASDAQ: COST ) and Michael Kors Holdings (NYSE: KORS ). These three companies need to import goods from abroad and sell them in the United States (with each having a minimum of 70% of revenues domestically). Foreign stocks that could benefit from a weaker euro include: Siemens ( OTCPK:SIEGY ) and Unilever (NYSE: UN ). Obviously this list is not all-inclusive and depending on whether you expect a weakening or strengthening economy you could favor more or less cyclical companies. Nearly every day market prognosticators try to convince investors to change their investment strategy. While it is difficult to ignore them when the market swoons that is precisely what most successful investors learn to do. It is more gratifying and ultimately more profitable to view short-term market fluctuations as random noise unless you have a compelling reason to think otherwise. Editor’s Note: This article discusses one or more securities that do not trade on a major exchange. Please be aware of the risks associated with these stocks.