Tag Archives: nysearcaxlu

Why You Should Own Utility Westar Energy

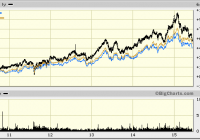
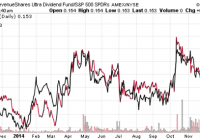
As regulated assets increase with reduced debt and equity needs, the incremental earnings should improve overall ROIC. With the decline in share price since peaking in January, Westar offers an acceptable yield and low payout ratio of around 64%. Kansas has a neutral regulatory environment, but growth is pegged to FERC-regulated transmission assets. Westar Energy (NYSE: WR ) is a mid-sized regulated electric utility in the heart of the Midwest. The company service 700,000 electric customers in central and northeast Kansas. WR also has a relatively high 6,200 miles of transmission lines and seven power plants with generating capacity of 7,160MW. There is a lot to like about WR from a longer-view perspective. Over the past 5 years, stock price performance has kept up with the Dow Jones Utility Index (DJU) and outperformed the S&P Utility Index (NYSEARCA: XLU ). However, over the last 6 months, WR has performed worse than these indexes by losing around 12% vs. 5% for the overall peer index. Morningstar reports 1-yr total return at -1.0% vs. its regulated electric utility peers at 3.1%, 3-yr total return at 9.3% vs. 11.3% respectively, 5-yr return of 14.1% vs. 11.3% respectively, and 10-yr total return at 7.6% vs. 8.3% respectively. Below are 5-yr and 6-month price only charts: 5-yr 6-month Westar’s Equity Quality rating by S&P Capital IQ for 10-yr consistency in earnings and dividend growth is A-. This falls within the top 25% of all publicly traded utilities with 10 firms rated A+ or A, and 15 firms rated A-. WR has an average credit rating at BBB+. Westar has been investing in its regulated asset base for the past several years. While WR has one of the largest capital expansion programs of a utility its size, free cash flow has remained almost neutral over the previous 2 ½ years. Previous expansion of WR regulated assets is driving the current growth in operating cash flow. For example, in 2011 and 2012, WR invested a combined $1.5 billion but had operating cash flow of just a bit over $1.0 billion, generating a free cash flow deficit of $500 million. However, in 2013 and 2014 combined, WR invested $1.6 billion and its operating cash flow increased to $1.5 billion, reducing the free cash flow deficit to $100 million. Over the trailing 12 months, WR has invested $821 million while generating operating cash flow of $800 million, for a deficit of only $21 million. Morningstar’s analysis of this asset driven aspect for Westar: Between 2006 and 2013, Westar increased its asset base from $5.5 billion to $9.6 billion, and we expect that it could top $11 billion by 2017. Its equity base has doubled since 2007 with its investments in new power plants, environmental upgrades, wind farms, and large transmission lines. With cash flow tight, investors have had to settle for pedestrian 3% annual dividend growth. But as Westar’s investment pace slows and rate increases flow in, dividend growth should accelerate. In addition, as Westar’s investment mix shifts to higher-return transmission projects, earned returns and cash flow should grow. Westar is waiting on a decision on a rate case that could increase rates by an average of 7.0% to 7.9%, and would represent the first rate increase since 2012. Included in the rate request will be approval of $600 million in upgrades to coal plants for environmental investments and to its nuclear plant to expend its useful life. While the company is requesting a $152 million rate increase, it is likely the PUC will approve around $135 million. In dealing with the issue of distributed generation, WR’s rate request include higher fixed charges with the monthly fee increasing for $12 to $15 in year one and to $27 by year four. If approved, the rate plans would shift a greater percentage of Westar’s revenues to fixed monthly fees, which better reflects the utility’s cost to serve its customers. Kansas is considered by S&P Credit to be a neutral regulatory environment. The anticipated allowed ROE for its state-regulated assets will be set at 10.0% with the resolution of the pending rate case. About 18% of WRs asset base are federally regulated transmission assets with a higher allowed ROE of 11.3%, and some projects in central Kansas carry an allowed ROE of 12.3%. However, the Kansas utility commission has filed an appeal to the FERC to reduce transmission ROE to just below 10%. Westar has a growing transmission profile as transmission investments will be about a third of the firm’s total cap ex budget. Currently, transco assets account of about 18% of its total regulated rate base at $1.1 billion. The company is expected to almost double the transco base over the next four years by investing $225 million a year in this business. Westar’s service area is smack in the middle of the wind-generating corridor of the Midwest with an abundance of project to connect wind farms with several grid operators to the north and south. Westar is well-versed in the transmission business and has a joint venture with American Electric Power (NYSE: AEP ) and MidAmerican Utility. On a per mile valuation comparable to ITC Holdings, the major independent publicly traded transco, Westar’s current network could be worth about $2.5 billion, or about $20 a share. With a target growth in base assets of 18% to 20% annually, not only is the regulated transmission business more profitable, but also is gaining sufficient critical mass to be considered an independent company. With the industry on the cusp of financial engineering for transmission assets, Westar is well positioned. Westar operates in a stable economic environment as described in their fourth qtr. conference call: Turning to the Kansas economy, it continues to hum along. Year-end unemployment was just over 4%, a level not seen since 2008. And it remains 150 basis points favorable to the nation. Small business formation continues at a good pace with most of that right in our service territory. Recent articles have touted our part of the world. Topeka was recently ranked America’s top ten most affordable cities by livability.com and a new report by the Brookings Institute ranked Wichita, which is our largest city that we serve, third in the nation among top 100 metro areas for concentration of jobs in advanced industries. These instances and a state report showing a 6% increase last year in the number of new businesses registered validate our outlook for our Kansas economy that has a lot of offer. Westar has historically generated above average return on invested capital ROIC. In an industry where the average ROIC is between 4% and 5%, since 2004, WR has consistently generated ROIC in the 5.5% to 6.0% level. Below is a 20-yr ROIC chart courtesy of fastgraph.com. (click to enlarge) With a weighted cost of capital of 5.2%, as calculated by ThatsWACC.com, management has barely generated sufficient returns over its cost of capital. On the brighter side, there are utilities that generate negative Net ROIC. However, as regulated assets increase with reduced debt and equity requirements, the incremental earnings should improve overall ROIC. Westar is trading at a slight discount to its peers with a forward P/E of 13.7. Below is a table from morningstar.com reflecting higher operating statistics such as 3-yr revenue and net income growth and operating margins compared to industry averages. However, these attributes is not reflected in the share price. Source: morningstar.com Fastgraph.com historic graph suggests WR is fairly valued. At the end of 2014, the yield was 3.4%, but has improved to a more historic year-end average of 4.1% yield (the downside to the yield improvement was a decline in price). Dividend growth has been a bit shy of many in the utility sector but could ramp up as earnings continue to grow at 6% a year. With the financial troubles of the early 2000s, an annual increase in the dividend goes back only 10 years, a bit light for a utility with Westar’s roots. The low payout ratio of 64% allows management to increase the dividend faster than its underlying earnings growth without jeopardizing its financials. (click to enlarge) The June investor’s presentation is one of the most through descriptions of various aspects of their business. Even current shareholders should learn something new by reviewing the information and it is recommended reading. However, Westar has a bit of a tarnished history . In 2002, then-CEO David Wittig and his Chief Strategic Officer were fired for alleged financial improprieties and the company, then known as Western Resources, almost went bankrupt. Wittig was convicted in federal court of 39 counts of financial malfeasance in 2005, but it was over turned in 2007. Amazingly, Wittig settled with Westar in 2011 to the tune of $42 million in compensation and legal fees from an unjust termination dispute while his underling negotiated a $22 million deal. In recap, Westar offers acceptable historic returns based on its peers, high quality ratings, rising operating cash flow to fund aggressive regulated asset accumulation, pending rate relief, good regulatory environment, growing regulated transmission asset base, increasing economic environment, stable ROIC and positive Net ROIC with the potential for increasing returns. With a typical current utility yield, the potential for above-average dividend growth is also attractive. What’s not to like about that? Author’s Note: Please review disclosure in Author’s profile. Disclosure: The author is long AEP. (More…) The author wrote this article themselves, and it expresses their own opinions. The author is not receiving compensation for it (other than from Seeking Alpha). The author has no business relationship with any company whose stock is mentioned in this article.

RevenueShares Ultra Dividend Has Utility

Summary RDIV has a relatively high yield compared to its nearest competitors such as DVY. RDIV takes the S&P 500 Index, pulls out the top 60 highest yielding stocks, and then weights them by revenues. RDIV’s strategy in the current market environment results in a very utilities heavy portfolio. RevenueShares takes a different approach to indexing. Instead of using the market capitalization approach to weighting index constituents, the firm uses a company’s share of revenues. RevenueShares takes an existing S&P index such as the S&P 500 Index and then applies the different weighting methodology. One of the main arguments against market capitalization weighted indexes is the valuation argument. As the price of a stock rises, so does its market cap, and over time a market cap weighted index becomes increasingly weighted towards overvalued shares. By using revenues as a weighting strategy, as a stock price rises faster than its revenue share, it is sold off at rebalancings. If a company’s stock price falls, but its revenues are steady or rise as a share of the index, it is purchased at each rebalancing. In other words, stocks that are overvalued by the price-to-sales metric are sold, and stocks that are undervalued by the price-to-sales ratio are purchased. RevenueShares has a dividend fund that uses this strategy: the RevenueShares Ultra Dividend ETF (NYSEARCA: RDIV ) . Index & Strategy As mentioned, RDIV weights the index by revenues. The index constituent universe is the S&P 500 Index. The field is narrowed to the top 60 stocks, ranked by the average 12-month trailing dividend yield. Holdings are then weighted by revenue. The result is a portfolio heavily overweight the top holdings in the modified index, as well as overweight the “defensive” sectors. The top 10 holdings are book-ended by Duke Energy (NYSE: DUK ) at the top, with a 5.07 percent weight as of January 26, and Kinder Morgan (NYSE: KMI ) at the bottom with 4.20 percent of assets. The top 10 holdings combine for 46.70 percent of assets. Utilities dominate sector exposure, with 39 percent of assets. The telecom sector is also overweight relative to the S&P 500 Index, at 17 percent of assets. Consumer staples and energy make up 16 percent and 13 percent of assets, respectively. Technology is almost non-existent at 0.19 percent of assets. Financials are very underweight relative to the S&P 500 at 4 percent of assets, and there’s no healthcare exposure. This makes for a very “defensive” portfolio whose performance currently lives and dies by the utilities sector. Performance RDIV’s inception date is October 2013. For much of this period, the utilities sector has performed very well and it was the best performing S&P 500 sector in 2014. The first chart here is the price ratio of RDIV versus the SPDR S&P 500 Trust ETF (NYSEARCA: SPY ) in red. In black, for comparison, is the price ratio of the Utilities Select Sector SPDR ETF (NYSEARCA: XLU ) versus SPY. The chart confirms what the sector exposure tells us: RDIV is highly influenced by the utilities sector. (click to enlarge) A dividend ETF with a similarly high concentration in utilities is the iShares Select Dividend ETF (NYSEARCA: DVY ), and the two funds fall into nearly the same section of Morningstar’s Stylebox: Large Cap Value. DVY falls on the line with the mid cap box and gets a Mid-Cap Value classification from Morningstar. The chart below shows the price ratio of RDIV to DVY, plus the price of the Industrial Select Sector SPDR ETF (NYSEARCA: XLI ). Industrials is the second largest sector in DVY. When industrials have rallied, RDIV trailed DVY, and vice versa. (click to enlarge) Finally, here’s a performance chart of RDIV, DVY, SDY and SPY since the inception of RDIV, showing that despite having different sector exposure, they’ve largely traded together. RDIV comes out on top thanks to it large utilities exposure. (click to enlarge) Expenses RDIV charges 0.49 percent. This is higher than DVY’s 0.39 percent and SDY’s 0.35 percent expense ratio. Income RDIV has a trailing 12-month yield of 3.26 percent. With only five quarters of dividend payments, it’s too early to evaluate the fund’s payout growth rate. The yield exceeds DVY’s 12-month trailing yield of 3.03 percent. Conclusion RDIV is a new fund that hasn’t found a large following yet, amassing only $52 million in assets in its first 15 months. The heavy weighting of the utility sector is an issue, but DVY has attracted nearly $16 billion in assets with nearly as much in the sector. Overall, the revenue weighting strategy shows a good track record and the yield on RDIV is competitive with the competition. Sector exposure won’t always lean in favor of utilities this much, but for the foreseeable future that’s likely to still be the case. Investors comfortable with that level of exposure can consider the fund as part of a dividend strategy. The main risk for the fund is the same for the utilities sector and dividend funds more generally. If interest rates stay low, investors will eventually bid up RDIV’s holdings until the yield gap with other dividend ETFs closes. If interest rates increase, the high debt utilities sector will come under pressure and investors will look beyond dividend shares to other income alternatives. Rates have come down substantially over the past couple of months though, so a major rebound will be required to take rates back to a level where they are competitive with stocks. The 30-year treasury yield was 2.40 percent as of January 26, down from 3.1 percent in November.

Utilities ETFs – Power To The People

Summary Utilities are a solid income-producing, low volatility plays. Look at utility ETFs as alternatives to one-stock options (Con-Ed, Duke Energy, Dominion) for more geographic and industry diversification. These utilities are largely made in America domestic investment options. Profiling the contenders (unless otherwise stated, market prices, NAV and SEC yield as of 1/23/15) : Vanguard Utilities ETF (NYSEARCA: VPU ) This ETF seeks to track the performance of a benchmark index that measures the investment return of stocks in the utilities sector and includes stocks of companies that distribute electricity, water, gas or that operate as independent power producers. Market price: $106.55 30-day SEC Yield: 3.14% Number of holdings: 78 iShares U.S. Utilities ETF (NYSEARCA: IDU ) This ETF seeks to track the investment results of an index composed of U.S. equities in the utilities sector. Market price: $123.23 30-day SEC Yield: 2.56% Number of holdings: 62 Guggenheim S& P 500 Equal Weight Utilities ETF (NYSEARCA: RYU ) This ETF seeks to replicate as closely as possible, before fees and expenses, the performance of the S&P 500 Equal Weight Index Telecommunication Services & Utilities. Market price: $81.17 30-day SEC Yield: 2.91% Number of holdings: 36 Utilities Select Sector SPDR ETF (NYSEARCA: XLU ) This ETF seeks to provide investment results that, before fees and expenses, correspond generally to the price and yield performance of the S&P Utilities Select Sector Index. Market price $49.14 30-day SEC Yield: 3.04% Number of holdings: 30 1) Diversification Diversification is the process of reducing non-systematic risk by investing in a variety of assets or asset classes that (hopefully) do not move up or down in value at the same time or magnitude. As the 2008 financial crisis taught us , there are certain unforeseeable events (think global recession, world wars) that no amount of diversification can protect us from. With diversification, you are at risk, without it you are doomed. a) Number of holdings An ETF does not need to hold every company of every sector that comprises its benchmark index, but 2 – 3 companies per industry is my subjective minimum to achieve adequate diversification. The utilities sector can be broken up into various industries including: electric utilities, multi-utilities, gas utilities, independent power and renewable electricity providers and water utilities. (click to enlarge) Winner: Guggenheim. While iShares and Vanguard both have more holdings, the concentration of risk with Duke Energy should not be ignored. Every dollar invested in Duke Energy is a dollar that can’t be invested in smaller regional electric and water companies that potentially could provide under the radar value for investors. b) Industry concentration Vanguard Utilities ETF (Courtesy of Vanguard) iShares U.S. Utilities ETF (Courtesy of BlackRock) Guggenheim S&P 500 Equal Weight Utilities (click to enlarge) ( (Courtesy of Guggenheim Investments) Utilities Select Sector SPDR ETF (Courtesy of State Street Global Investors) Winner: Guggenheim. I like that it has three industries that make up 10% or more of total investments, compared to only two for the competition. While diversified telecommunication services sounds a lot like AT&T, Verizon et al, this high barrier-to-entry quasi utility addition adds recurring revenue and relatively higher yield to the mix. 2) Expense ratio The SEC defines expense ratio as the total of a funds operating expenses, expressed as percentage of average net assets. The expenses include management fees, Distribution/service or “12b-1” fees, custodial, legal, accounting, etc. Lower expense ratios, either through larger size or smaller nominal expenses mean higher investment returns. (click to enlarge) Winner: Vanguard. John C. Bogle , founder of Vanguard: The grim irony of investing, then, is that we investors as a group not only don’t get what we pay for, we get precisely what we don’t pay for. So if we pay for nothing, we get everything. Honorable mention: the other three. According to Morningstar data , the average expense ratio for similar funds is 1.28%. 3) Total return (click to enlarge) Winner: Guggenheim. The Guggenheim S&P 500 Equal Weight Utilities ETF has outperformed Vanguard, iShares, and SPDR on both three and five year horizons. Past performance is no indicator of future results, naturally, but I believe this result is indicative of a superior indexing methodology. 4) Valuation multiples Winner: Vanguard. The Vanguard ETF is trading at a slightly lower multiple to TTM earnings, and a reasonable price/book ratio related to its competitors. 5) Liquidity The ability to get out of a great investment is just as important as the ability to get in. While ETFs are generally regarded as having higher liquidity than mutual funds (primarily because they can be traded throughout the day, rather than just at the end), there are reasons to avoid ETFs with excessively low volume. Chief among these are higher bid-ask spreads, which may result in the inability to profitably execute a short-term trade (not a real issue for long-term investors). However, one of the issues that arises from low liquidity (a deviation between price and NAV) can actually be an opportunity. If an ETF is trading slightly below its NAV, but the market is not active enough for it to quickly resume equilibrium, you can shave a few points off your basis by looking for opportune entry points. (click to enlarge) (click to enlarge) Winner: SPDR. Higher volume means tighter bid-ask spreads, full stop. 6) Yield (click to enlarge) Winner: Vanguard. Honorable mention: Everyone else. All four ETF options offer better income producing prospects than a 30 year treasury (2.38%), the S&P 500 (1.97%), and Dow Jones Utility Average (2.40%). 7) Volatility (click to enlarge) Winner: SPDR. Over three and five-year time-frames, SPDR has been less volatile than Vanguard, iShares and Guggenheim, and significantly less volatile than markets as a whole. 8) Dividend history and growth Source: finance.yahoo.com Winner: Tie: SPDR and iShares. The SPDR and iShares ETF have increased their annual dividend each year since 2009. Growing dividend payments is one way to try and keep up with inflation, and based on this 6 year time-frame, SPRD and iShares best accomplish this. So, which Utility ETF should you own? SPDR! The Utilities Select Sector ETF by SPDR is: the most active (liquid), the least volatile, offers the second highest yield, the second lowest expense ratio, and is one of only two of the funds analyzed that has increased dividends each year since 2009. A word of caution Utilities stocks are generally thought of as defensive plays, and could underperform in a rising or bull market. Also, significant sustained changes in the cost of energy production and delivery or interest rates could negatively impact all of these stocks. That is no excuse, however for not considering allocating at least a portion of your portfolio to these low-volatility ETFs. Do your homework, review the composition and risk profile of each of these ETFs and monitor your holdings.