Tag Archives: nysearcaxle

Are Energy Stocks Finally A Buy?

Is this the time to buy a basket of energy stocks? Yes. Though, I should start by stating the obvious: We are awash in oil, and this market looks to be oversupplied for quite some time. On Thursday, the Energy Information Administration rattled energy stocks by reporting that U.S. crude inventories just saw their highest weekly jump in at least 14 years . Still, this is not the first time we’ve seen a bust in the oil patch. We will almost certainly see business failures as high-cost and highly indebted shale producers go belly-up. But the beauty of an ETF like the Energy Select Sector SPDR (NYSEARCA: XLE ) is that it is dominated by mega-cap supermajors and pipeline operators – the kinds of companies with the balance sheet strength to buy productive assets on the cheap, if we do see forced selling. Let’s take a look at the energy stocks that dominate XLE’s portfolio. Company Symbol % Assets Exxon Mobil Corporation (NYSE: XOM ) 16.63% Chevron Corporation (NYSE: CVX ) 13.63% Schlumberger N.V. (NYSE: SLB ) 7.22% Kinder Morgan, Inc. (NYSE: KMI ) 4.51% ConocoPhillips (NYSE: COP ) 3.95% EOG Resources, Inc. (NYSE: EOG ) 3.87% Occidental Petroleum (NYSE: OXY ) 3.43% Pioneer Natural Resources (NYSE: PXD ) 3.16% Anadarko Petroleum (NYSE: APC ) 3.06% Williams Companies, Inc. (NYSE: WMB ) 2.68% At the top of the list is, of course, that juggernaut of all oil supermajors, ExxonMobil Corp. Exxon accounts for 16.63% of XLE’s portfolio. Exxon will take its licks when it reports earnings. Consensus estimates have the company’s earnings dropping by about 29% when it reports. Yet, Exxon’s dividend is more than adequately covered, and it’s worth noting that it has raised its dividend for 32 consecutive years. Yes, even during the dark days of the 1980s and 1990s, when crude oil traded at generational lows, Exxon managed to keep growing its dividend. Furthermore, at 3.0%, this company is a relative high-yielder in a world in which the 10-year Treasury yields just 1.9%. Moving on, Chevron makes up another 13.63% of XLE’s portfolio. The company has raised its dividend for 27 consecutive years, and currently yields 3.9%. Like Exxon, Chevron’s dividend is more than adequately covered. The dividend payout ratios for Exxon and Chevron are 33% and 38%, respectively. There is a lot of room for crude oil prices to go lower before either of these stocks see their dividends at risk. Schlumberger takes the third spot, at 7.22%. As an oil services company rather than a supermajor, Schlumberger is riskier than Exxon or Chevron. As oil companies slash exploration, the service providers stand to absorb more of the loss in revenue. That’s ok. Schlumberger has lived through its share of both energy bull markets and bear markets, and it’s still here to tell the story. I wouldn’t aggressively buy Schlumberger as a standalone stock right now, but its 7.22% weighting here is more than acceptable. I really wish that Kinder Morgan Inc. gets a larger weighting than its current 4.51%. Kinder Morgan is one of the biggest and best-capitalized pipeline operators in the business, and I fully expect the company to go on a buying spree if some of its weaker competitors go bust. It’s worth noting that founder Richard Kinder started the company by buying unwanted pipeline assets from Enron for a song. Long after Enron bit the dust and became a byword for all that is wrong with corporate America, Mr. Kinder’s creation is going stronger than ever. Has the price of crude oil finally hit bottom? Probably not. But I’m ok with that. Energy stocks remain one of the few cheap sectors in an otherwise expensive market, and XLE provides a fine way to get exposure to the biggest and best. This article first appeared on Sizemore Insights as Are Energy Stocks Finally a Buy? Disclaimer: This article is for informational purposes only and should not be considered specific investment advice or as a solicitation to buy or sell any securities. Sizemore Capital personnel and clients will often have an interest in the securities mentioned. There is risk in any investment in traded securities, and all Sizemore Capital investment strategies have the possibility of loss. Past performance is no guarantee of future results.
Big Energy ETFs Could Face Big Dividend Cuts

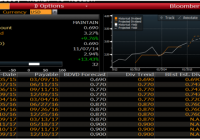
Energy stocks have been pummeled by lower oil prices. Now, energy companies may be forced to cut dividends. The highlight of oil sector ETFs and potential areas of weakness. By Todd Shriber & Tom Lydon Already under considerable pressure with oil prices falling and valuations on the rise, energy sector exchange traded funds are confronting a new problem: The potential, emphasis on “potential,” for dividend cuts from some of the sector’s largest companies. Major equity-based energy ETFs from the Energy Select Sector SPDR ETF (NYSEARCA: XLE ) to the Vanguard Energy ETF (NYSEARCA: VDE ) and the Fidelity MSCI Energy Index ETF (NYSEARCA: FENY ) could be stung by dividend cuts from marquee holdings if oil prices remain and/or fall further, forcing producers to look for ways to conserve cash. If the options market is accurate, the specter of energy sector dividend reductions must be acknowledged. Perusing 2016 at-the-money options data, the options market is pricing in dividend cuts for some of the biggest U.S. oil companies and some of the largest holdings in the aforementioned ETFs. For example, Bloomberg data indicate, based on the company’s recent dividend growth trajectory, Occidental Petroleum (NYSE: OXY ) will grow its payout to $3.20 per share per year over the next 12 months from the current level of $2.88 per share. However, the options market says Occidental’s payout could fall to $2.60. ConocoPhillips (NYSE: COP ), the largest U.S. independent oil and gas producer, assuming the options market is accurate, will also see its annual payout fall to $2.60 from $2.92 per share. ConocoPhillips and Occidental are XLE’s sixth- and seventh-largest holdings, respectively, combining to make up 7.3% of the largest energy ETF ‘s weight. Schlumberger (NYSE: SLB ), the world’s largest oilfield services provider, recently announced a 25% dividend increase, bringing its payout to $2 per share per year. The options market is not impressed, and sees the potential for that dividend to fall to $1.40 a share. Schlumberger is XLE’s third-largest holding, at a weight of almost 7.2%, and the largest holding in the Market Vectors Oil Services ETF (NYSEARCA: OIH ) , at 20.2% of that fund’s weight. OIH and rival oil services ETFs have already endured ample dividend cut speculation, some of which was confirmed in November when Seadrill (NYSE: SDRL ) said it was suspending its $1 per share quarterly dividend until at least the end of 2015. Analysts have noted Diamond Offshore’s (NYSE: DO ) special dividend policy is at risk, while highlighting Transocean (NYSE: RIG ) as a potential dividend cutter . In what could be a real shocker, the options market is also pricing in potential dividend cuts by Exxon Mobil (NYSE: XOM ) and Chevron (NYSE: CVX ), the two largest U.S. oil companies. Based on recent dividend growth, it would be reasonable to expect Exxon’s and Chevron’s dividends to rise to $3 and $4.52, respectively, over the next year. However, options data say $2.71 and $3.99, both below current levels, could be in the cards for Exxon and Chevron. Exxon and Chevron combined for 30.3% of XLE’s weight as of Monday and 34.8% of VDE at the end of December. Several factors should not be overlooked, not the least of which is that the options market could be proven wrong. Second, the companies mentioned here have options for cash conservation before moving to dividend cuts, including reducing capital expenditures and trimming buybacks. Exxon is one of the largest repurchasers of its own shares in the U.S. Third, several of these companies have proven they are highly committed to consistently raising their dividends. For example, Exxon and Chevron are members of the S&P Dividend Aristocrats Index, which requires dividend increase streaks of at least 25 years for inclusion. With its new dividend, Schlumberger’s payout has nearly doubled since 2008. Occidental’s dividend has more than doubled since 2010. Still, even the thought of dividend cuts comes when energy stocks are vulnerable to negative earnings revisions and valuations that are high despite slumping oil prices. “The forward 12-month P/E ratio for the S&P 500 now stands at 16.6, based on (last week’s closing price (2063.15) and forward 12-month EPS estimate ($124.04). Given the high values driving the ‘P’ in the P/E ratio, how does this 16.6 P/E ratio compare to historical averages? What is driving the increase in the P/E ratio? The current forward 12-month P/E ratio of 16.6 is now well above the three most recent historical averages: 5-year (13.6), 10-year (14.1), and 15-year (16.1)” – Rareview Macro founder, Neil Azous. (click to enlarge) Chart Courtesy: Bloomberg

Materials ETFs Mauled By Falling Oil Prices

Summary Energy prices are falling. Low oil prices are weighing on the materials sector. Materials are experiencing lower activity on energy fallout. Oil’s slide has identified some winners at the sector level, namely consumer-related shares, but beyond the energy sector, there are some losers as well. Those losers include the materials sector, which was already scuffling heading into 2015. Last year, the Materials Select Sector SPDR ETF (NYSEARCA: XLB ) rose just 7.2%, including paid dividends. XLB’s 2014 showing was 630 basis points worse than the S&P 500, and enough to make the fund the second-worst of the nine sector SPDR ETFs, behind only the Energy Select Sector SPDR ETF (NYSEARCA: XLE ) . To this point in the new year, only three of the nine sector SPDRs have traded higher. XLB is not a member of that trio. In theory, materials stocks should be winner in a low energy price environment, because lower oil and gas prices reduce input costs for energy-intensive materials producers and chemicals manufacturers. In reality, that has not been the case. While the materials sector’s earnings warnings have not yet reached alarming heights, it is clear oil’s plunge is taking a toll on the sector. Of XLB’s top 10 holdings, a group that combines to make up about two-thirds of the ETF’s weight, only three have traded higher to start 2015. “The investment markets reflect these winners and losers in the economy. Consumer driven sectors of the market have performed quite well. The energy and commodity sectors of the market have not. Between oil stocks, the materials sector, and industrial and utility names in commodity-related businesses, roughly 20 percent of the S&P 500 is a loser with falling oil prices.” – Jones & Associates LyondellBasell Industries (NYSE: LYB ), one of XLB’s top 10 holdings, said that in the fourth quarter low oil prices will damp its margins. That after the company helped materials ETFs perform well in the first half of 2014 on the back of rising crude prices . A recent Morgan Stanley report highlighted PPG Industries (NYSE: PPG ), a top 10 holding in XLB, as one materials name that could endure lower oil prices, but the bank also identified Eastman Chemical (NYSE: EMN ), LyondellBasell and Dow Chemical as potentially challenged by lower oil prices. Those stocks combine to make up over 16% of XLB’s weight. XLB’s five-year correlation to The United States Oil ETF (NYSEARCA: USO ) is over 59%, according to State Street data . Materials Select Sector SPDR ETF (click to enlarge)