Tag Archives: nysearcaxle

The Oil Crash: 3 ETFs For Targeted Investment In The Energy Sector

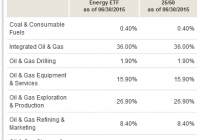
Summary My breakfast reading this morning was an article from a fellow Seeking Alpha author suggesting that bargains could be found in the energy sector. While disagreeing with nothing in his article, I wondered what I could offer an investor who might be interested in using ETFs for a diversified investment in the sector. I came up with three solid candidates. This article will provide a brief overview. As a Seeking Alpha author myself, as time allows I enjoy reading as many articles as I can from fellow authors. My breakfast reading this morning included this article from fellow Seeking Alpha author Regarded Solutions . I think it is a great article, and well worth taking the time to read it for yourself. Essentially, though, the premise was as follows: The energy sector has been killed recently, due to the low price of oil. However, unless one believes in the imminent demise of oil and all its uses, now may be a good time to at least look at scaling into bargains. In particular, the author recommends taking a hard look at Exxon Mobil (NYSE: XOM ). Before I go any further, let me be explicit that it is not the purpose of my article to either dispute any of the points in his article nor to diminish anyone’s interest in purchasing shares in Exxon Mobil. However, I am ETF Monkey, after all. “What,” I thought, “might I suggest to the person who liked the concept, but wished to employ the power of ETFs to diversify their risk, as well as possibly invest in small, incremental chunks?” My research led to three quality candidates: Vanguard Energy ETF (NYSEARCA: VDE ) Energy Select Sector SPDR Fund (NYSEARCA: XLE ) iShares U.S. Energy ETF (NYSEARCA: IYE ) Let’s take a quick look at each ETF, and then I will offer a couple of concluding comments at the end. Vanguard Energy ETF Let’s start with some relevant data from the current factsheet . VDE has an inception date of 9/23/04, so has been around for almost 11 years. It tracks the MCSI USA Energy IMI 25/50 Index . As of 6/30/15, the fund contains 151 stocks, compared to 149 in the index. It has $5.0 billion in Assets Under Management (AUM). In classic Vanguard fashion, it carries a very low .12% expense ratio and has an average spread of .03%, very good performance for a sector-specific ETF. Finally, it carries a 30-day SEC yield as of 7/27/15 of 2.76%. Here is a look at the sector breakdown: Next, let’s have a look at the Top 10 holdings, after which I will offer a couple of comments. (click to enlarge) I’d just like to draw your attention to a couple of things: You may have noted that Exxon Mobil is the fund’s top holding, at 21.3%. In other words, for every $1,000 you invest, you are essentially investing $213 in Exxon Mobil. Even though there are 151 stocks in the portfolio, the Top 10 comprises 62.1% of total net assets. This is a much higher concentration than a broader market index ETF, such as the Vanguard Total Stock Market ETF (NYSEARCA: VTI ), for which the Top 10 holdings only comprise 14.4% of total net assets. However, in this context, this is a good thing. You are still making a very targeted investment in a sector, while still retaining a measure of defense against single-entity risk . Within the sector, the major portion of your funds are in developed, established companies. Energy Select Sector SPDR Fund Again, let’s start with relevant data from the latest factsheet . XLE, from State Street Global Advisors (NYSE: STT ), one of the oldest providers of ETFs, has an inception date of 12/16/1998. It tracks the S&P Energy Select Sector Index . As of 6/30/15, the fund contains 42 stocks, compared to 40 in the index. It has $11.6 billion in AUM. The fund carries a very competitive .15% expense ratio and has an average spread of .01%, which is truly exemplary for a sector-specific ETF. Finally, it carries a 30-day SEC yield as of 7/27/15 of 2.89%. Here are the fund’s Top-10 holdings: A couple of notes: Despite the far smaller number of stocks in XLE vs. VDE (40 vs. 151), the Top 10 concentration is virtually the same; 61.64% for XLE vs. 62.10% for VDE. At the same time, Exxon Mobil’s weighting is “only” 16.38% here vs. 21.30% in VDE. Therefore, your decision between the two may at some level hinge on how much concentration you wish to have in Exxon. iShares U.S. Energy ETF As always, some relevant data from the latest factsheet . IYE, from BlackRock, Inc. (NYSE: BLK ), has an inception date of 6/12/00. It tracks the Dow Jones U.S. Oil & Gas Index . As of 6/30/15, the fund contains 92 stocks, compared to 93 in the index. It is the smallest of the three ETFs, with $1.27 billion in AUM. The fund has an average spread of .03%, and carries a 30-day SEC yield as of 6/30/15 of 2.50%. Unfortunately, IYE also carries an expense ratio of .45%, meaning that the fund would need to outperform our two competitors by some .3% per year to overcome the handicap from expenses. Here are the fund’s Top-10 holdings: My thoughts: IYE is in the middle of the pack in terms of diversification, with 92 holdings. It’s Top 10 concentration is the greatest of the three ETFs, at 63.69%. Its weighing in Exxon Mobil is also the highest of the three; at 22.57% vs. VDE’s 21.30% and XLE’s 16.38%. Again, this may factor into your decision if you desire a heavier weighting in Exxon. Comparative YTD Performance As featured in the article that inspired this offering, the energy sector has been hit hard recently. That being the case, how have our three ETFs performed? Have a look: VDE data by YCharts As you can see, VDE and XLE are in a virtual dead heat, with only .1% separating them. It becomes basically a tie when you factor in XLE’s slightly higher 2.89% vs. 2.76% SEC yield. Summary and Conclusion Based on my examination, I am going to call it a tie between VDE and XLE. Both have long track records. Both have impressive amounts of AUM. And both have very competitive expense ratios which, all other things being equal, ultimately puts money in your pocket. As always, though, I will include the caveat that the question of which ETF you can trade commission-free may factor into your ultimate decision, particularly if you wish to make multiple small, incremental investments. My thanks to Regarded Solutions for a wonderful inspiration, and to all of you for reading. Happy investing! Disclosure: I/we have no positions in any stocks mentioned, and no plans to initiate any positions within the next 72 hours. (More…) I wrote this article myself, and it expresses my own opinions. I am not receiving compensation for it (other than from Seeking Alpha). I have no business relationship with any company whose stock is mentioned in this article. Additional disclosure: I am not a registered investment advisor or broker/dealer. Readers are advised that the material contained herein should be used solely for informational purposes, and to consult with their personal tax or financial advisors as to its applicability to their circumstances. Investing involves risk, including the loss of principal.
Remember July 2011? The Stock Market’s Advance-Decline (A/D) Line Remembers

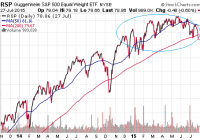
Paying a premium for growth is one thing. Chasing a handful of momentum stocks is another. Six corporations account for more than the entirety of the meager 2015 gains in the S&P 500. What happens when one examines the S&P 500 on an equal-weighted basis? Clearly, there is a dichotomy between the health of the overall stock market and the relatively high price of the popular benchmarks. According to Bloomberg data, the modest year-to-date increase in the S&P 500 is attributable to health care and retail alone. Worse yet, the two industry segments trade at a 20% premium to the market at large. Paying a premium for growth is one thing. Chasing a handful of momentum stocks is another. Brokerage firm Jones Trading sharpened the knife even further, noting that six corporations account for more than the entirety of the meager 2015 gains in the S&P 500. Those companies? Amazon (NASDAQ: AMZN ), Apple (NASDAQ: AAPL ), Facebook (NASDAQ: FB ), Gilead (NASDAQ: GILD ), Google (NASDAQ: GOOG ) and Walt Disney Co (NYSE: DIS ). The narrowing of the market itself coupled with the types of businesses on the list (with the possible exception of Walt Disney) strongly resembles late 1990s euphoria . What happens when one examines the S&P 500 on an equal-weighted basis? We find that that stocks have been stuck in one of the tightest trading ranges in market history for as long as the Federal Reserve ended quantitative easing (“QE3″). Here is the performance of the Guggenheim S&P Equal Weight ETF (NYSEARCA: RSP ) since QE3 wrapped up at the end of October in 2014. The ongoing deterioration in the S&P 500’s Bullish Percentage Index (BPI) underscores the challenges that investors face. Do they chase the Googles and the Gileads? Do they look for value in the energy patch through acquiring beaten down exchange-traded proxies like the Energy Select Sector SPDR ETF (NYSEARCA: XLE )? Or do they recognize that 50% of the S&P 500 components are currently in downtrends – a demarcation that is unfavorable for the long-term sustainability of the 3rd longest bull in history. Clearly, there is a dichotomy between the health of the overall stock market and the relatively high price of the popular benchmarks. Addressing the internal components of major benchmarks like the S&P 500, Dow Jones Industrials, NYSE Composite or NASDAQ as they relate to the handful of momentum leaders in those benchmarks leaves one to ponder what will happen next. Will the weight of the overall market crush the Atlas-like performance of health and retail? On the flip side, is it possible that underachieving sectors like industrials, materials, energy, utilities, transports and telecom might join the winner’s circle? Unfortunately, history suggests that overvalued sectors tend to crumble and join the beleaguered areas, as opposed to the troubled spots catching a bid first. Indeed, the last time that the New York Stock Exchange’s Advance Decline Line (A/D) Line fell below a 200-day moving average, the broader S&P 500 fell more than 19%. It occurred in July of 2011 as the euro-zone crisis had been spiraling out of control. For those that believe the illusion of economic acceleration could help the cause, media spin and double seasonally adjusted GDP reporting will not help. The reality of a lusterless U.S. economy is far too great. The manufacturing, mining, and utilities that collectively comprise the industrial sector recently registered its weakest year-over-year growth in a half-decade. Wholesale sales have dropped steadily over the past four years. Exporting on a strong dollar has been difficult for those multi-nationals that operate in Asia and Europe. Wage growth has been stuck in and around 2% since the end of the Great Recession in 2009. The workforce participation rate – a measure of actual employment – is as poor as it had been in the recession-weary late 70s. And homeownership at 63.4% is the lowest that it has been since 1967. What about the consumer? Aren’t people feeling wealthier? I suppose this depends upon the people you ask. The Conference Board’s U.S. Consumer Confidence was about as discouraging a data point as anyone has seen lately. Consumer expectations plummeted from 92.8 to 79.9 – the lowest reading since February 2014. And Gallup’s reading last week wasn’t much better; that is, for whatever reason, Americans believe the economy is getting worse. As long as the Federal Reserve maintains its plan to raise the cost of borrowing, and as long as the U.S. dollar rises alongside those expectations, the broader market is likely to remain range-bound. You’d have to hold the horses that have been winning, like the iShares S&P 100 ETF (NYSEARCA: OEF ) and the Health Care Select Sect SPDR ETF (NYSEARCA: XLV ). Yet you wouldn’t necessarily want to add to your overall equity position. You might also want to avoid areas of the market that are weakening in the face of higher borrowing costs and a higher greenback. The Industrial Select Sector SPDR ETF (NYSEARCA: XLI ) have gone nowhere in the nine months since QE3 officially ended. Click here for Gary’s latest podcast. Disclosure: Gary Gordon, MS, CFP is the president of Pacific Park Financial, Inc., a Registered Investment Adviser with the SEC. Gary Gordon, Pacific Park Financial, Inc, and/or its clients may hold positions in the ETFs, mutual funds, and/or any investment asset mentioned above. The commentary does not constitute individualized investment advice. The opinions offered herein are not personalized recommendations to buy, sell or hold securities. At times, issuers of exchange-traded products compensate Pacific Park Financial, Inc. or its subsidiaries for advertising at the ETF Expert web site. ETF Expert content is created independently of any advertising relationships.

The Oil Trade Update

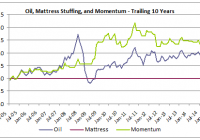
Like most risky asset classes, oil exhibits short-term momentum. Investors seeking short-term gains from timing a bounce in oil prices should understand this phenomenon, which could be reversing. After seven monthly losses for oil, momentum might finally have turned the corner, giving traders with a shorter-term horizon impetus to add positions. While evolving supply and demand factors impacting oil prices favor a longer-term value investing approach, a simple momentum heuristic could point to potential near-term gains. This is a re-purposed version of an earlier article that cautioned potential investors to take a long-term value approach to falling prices. As I have written previously, the performance of oil exhibits short-term momentum. What does that mean? On average, falling oil prices continue to fall in the short term. Conversely, rising oil prices continue to rise in the short term. Like I have done previously in articles about momentum’s impact on the returns stocks and bonds , I can demonstrate this phenomenon empirically. Understanding the power of short-term momentum can help Seeking Alpha readers more ably position oil-related exposures. Oil prices have been falling for several months, dragging down energy-related investments. With oil prices stabilizing and beginning to rebound, the negative trend from momentum could also be reversing. Imagine a world with just two asset classes – oil and your mattress. Knowing that oil exhibits short-term momentum, you invest in oil when it has produced a positive return over the trailing one month. If oil is falling, you stick your money in your mattress, earning zero. The cumulative return profile of oil, mattress savings, and a momentum strategy that toggles between oil and mattress stuffing based on which had outperformed for the trailing one month and holds that leg forward for one month is diagrammed below for the trailing ten-year period (see full results at the end of the article). Over the last ten years, if you had stuffed your money in the mattress, you would have of course earned zero. If you had purchased oil, this recent downturn would have taken you to a negative ten-year cumulative return. If you would have properly understood the momentum phenomenon, you would have more than doubled your money. (Source: Bloomberg WTI Crude) This simple heuristic to knowing when not to invest in oil based solely on trailing returns delivers tremendous outperformance. Even before the recent downdraft in oil prices, the oil/mattress momentum strategy outperformed a long-only oil strategy materially. Why? First, the countries, companies, and cartels that are major players in the global market are very large, and the forces that shape oil prices are slow-moving. Even absent the game theory inherent in supplying oil, reducing supply to the market takes time. Conversely, there is a lag effect from higher demand and prices manifesting into increased exploration via the drill bit. Secondly, short-term momentum is a powerful market anomaly present in many markets. (See Erb and Harvey (2006) on momentum impacts in commodity markets, or a litany of sourced articles I have written on the subject in other asset classes with performance proof). This does not mean that beaten-down energy stocks are a bad investment today, just that picking a short-term bottom in oil prices to generate short-term gains is a difficult proposition. If you are underweight energy stocks, then you should examine an increased allocation. As demonstrated pictorially in the chart below, buying energy stocks after a correction tends to generate very strong long-term performance. This graph shows the S&P Energy Index, replicated by the Energy Select Sector SPDR Fund (NYSEARCA: XLE ), over the trailing 25 years graphed against oil. (Source: Bloomberg, Standard and Poor’s) When I first wrote a version of this article in early December, short-term momentum suggested that oil prices and energy stocks could weaken further. Oil has fell an additional 32% over the next two months through the end of January. With oil again producing a negative return in January, the momentum strategy would again suggest that investors stay out of energy-related investments this month. My momentum strategy uses monthly calendar returns, in part because it is easier to find monthly return information historically. One-to-three month momentum with one to three month lookbacks have been shown to produce alpha across asset classes, markets, and time. Using a one-month lookback from today until mid-January and oil prices have risen by 13%. Perhaps this turnaround signals reversing momentum and further gains ahead. I have added to energy-related investments with an eye towards long-term value. Short-term momentum helped me to avoid the deepening correction. These investments have included a factor tilt towards low-cost energy focused exchange-traded funds. Given my traditional tilt towards low volatility investments (NYSEARCA: SPLV ), I was underexposed to energy pre-correction. I added broadly to closed-end high yield bonds funds, w hich were disproportionately negatively impacted by the oil drawdown . I have also added closed-end funds like Clearbridge American Energy MLP Fund (NYSE: CBA ), a pipeline focused MLP which was trading at nearly a ten percent discount to net asset value and generating a nearly eight percent yield at the time of purchase. The midstream sector is less exposed to commodity prices, and the selloff appeared to be overdone with investors selling energy-related funds indiscriminately early in the correction. A more speculative play was my add to Memorial Energy Production Partners (NASDAQ: MEMP ), an energy and production-related MLP that had strongly hedged several years of forward production as part of its business strategy, but suffered in the downturn like it was fully exposed to the commodity price drawdown. MEMP still offers nearly a 13% distribution rate even after the recent bounceback. Another long-term value play in the Energy space was my purchase of busted business development company, OHA Investment Corporation (NASDAQ: OHAI ). The company, formerly known as NGP Capital Resources is heavily exposed to the oil and gas industry with seventy percent of investments in those sectors. The company has recently brought in leading distressed debt manager Oak Hill Advisors to manage the fund. The company is trading at over a forty percent discount to net asset value. While I expect further impairments on its energy loans and a likely dividend cut, the combination of the deep discount, strong manager, inside management purchases, low leverage, and healthy liquidity all make a long-term rebound and strong forward risk-adjusted returns appear likely. Of my energy adds, this has been the worst performer thus far, but I believe downside is limited with the market capitalization trading roughly equal to the value of cash, Treasury bills, and non-Energy investments on the balance sheet. Do not be distracted by the potential for short-term losses and heightened volatility. Successful investing in oil and oil-related stocks is as simple as expanding your investment horizon. Even if you trade with a shorter-term focus, momentum could be reversing in oil given the positive trailing one-month return. Disclaimer: My articles may contain statements and projections that are forward-looking in nature, and therefore inherently subject to numerous risks, uncertainties and assumptions. While my articles focus on generating long-term risk-adjusted returns, investment decisions necessarily involve the risk of loss of principal. Individual investor circumstances vary significantly, and information gleaned from my articles should be applied to your own unique investment situation, objectives, risk tolerance, and investment horizon. Appendix on Oil/Mattress Momentum: (click to enlarge) Disclosure: The author is long XLE, OHAI, MEMP, CBA, SPLV. (More…) The author wrote this article themselves, and it expresses their own opinions. The author is not receiving compensation for it (other than from Seeking Alpha). The author has no business relationship with any company whose stock is mentioned in this article.