Tag Archives: nysearcaxhb

2 Sectors Gaining On Steady Labor Market

Recently released economic data indicated that the labor market is witnessing robust recovery. A significant decline in the initial claims figure released Thursday further reaffirmed the strong improvement. Several sectoral data published lately showed that the retail and housing sectors are gaining the most from this improving labor market trend. Steady Labor Market The U.S. Department of Labor reported that jobless claims declined from the prior week’s level of 279,000 to 267,000 for the week ending June 13, significantly below the consensus estimate of 276,500. This marked the fifteenth consecutive week of initial claims tally remaining below 300,000, marking its lengthiest stretch below this level in nearly 15 years. Meanwhile, according to nonfarm payroll data released earlier this month, the economy created a total of 280,000 jobs in May, witnessing the largest job addition since Dec 2014. Also, except for March, the labor market witnessed healthy job additions throughout the year after creating nearly 2.95 million jobs in 2014 – its highest in 15 years. Though the unemployment rate marginally rose to 5.5% in May, the rate is expected to decline gradually to Fed’s target this year. Average hourly wages also saw an impressive year-on-year gain of 2.3%, indicating a strong recovery in labor market conditions. Trending Sectors Retail Retail is one of the main sectors to benefit significantly from the steady labor market this quarter. Last week, the U.S. Department of Commerce reported that retail sales increased 1.2% in May from the previous month to $444.9 billion, significantly higher than April’s revised gain of 0.2%. It was also reported that retail sales rose 2.1% year over year through the March to May period. Meanwhile, March’s gain was revised upward to 1.5%, marking the highest monthly gain in almost five years. Separately, the University of Michigan and Thomson Reuters’ preliminary reading of consumer sentiment was at 94.6 in June. This was more than the consensus forecast of an increase to 91.2 as well last month’s figure of 90.7. Another report released this month also revealed that consumer credit increased at a seasonally adjusted annual rate of 7.25% in April. All of these data go to show that the economy is on a solid footing. Impressive recovery in this sector is likely to have a positive impact on retail ETFs including the Market Vectors Retail ETF (NYSEARCA: RTH ) and the SPDR S&P Retail ETF (NYSEARCA: XRT ) . While RTH carries a Zacks ETF Rank #1 (Strong Buy), XRT holds a Zacks ETF Rank #2 (Buy). Hence, investors may bet on these two ETFs to gain from the improving retail environment. Housing This is another sector that has rebounded strongly in the second quarter overcoming the negative impact of a harsh winter in the first banking largely on strong labor market conditions. The National Association of Home Builders (NAHB)/Wells Fargo housing market index rose five points from May to 59 in June, in line with the September 2014 reading. September’s reading was, by the way, the highest since Nov 2005. This was also the highest reading in the last nine months. Despite a decline in housing starts, most of the housing data released recently reveals that the housing sector is ready to make considerable gains. While building permits have hit a near six-year high in May, U.S. construction spending touched its highest level in more than six years in April. Separately, a significant rise in home prices also signaled an increase in demand in the housing market. Housing market recovery in the second quarter boosted homebuilder ETFs like the PowerShares Dynamic Building and Construction Portfolio ETF (NYSEARCA: PKB ) and the SPDR Homebuilders ETF (NYSEARCA: XHB ) . In the past three months, PKB and XHB gained around 5.2% and 2.3%, respectively. Both these ETFs carry a Zacks ETF Rank #3 (Hold). These ETFs are likely to gain further on a brighter outlook on housing and are thus likely to remain on investors’ radar. Originally posted on Zacks.com
Lumber Is The Canary In The Homebuilders’ Coal Mine

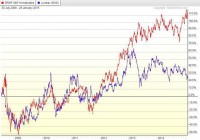
Summary Lumber prices have historically tracked quite well with homebuilder stocks. Homebuilders have also recently surged past the S&P in recent months. With the deceleration in price gains still going on and Fed support quickly evaporating, there is nothing left to prop up this industry. While I have been generally skeptical of the supposed recovery in homebuilder stocks, I have limited my analysis to trends in home prices and the ability of the American consumer to handle a mortgage at current prices. For me, this analysis is sufficient to show that homebuilder stocks are in a pretty large bubble. In the following article, though, I plan to show the value of homebuilder stocks relative to lumber prices, which themselves are a good economic indicator, but also tend to follow the valuation of homebuilder stock. The Tight Relationship of Lumber and Homebuilders (click to enlarge) In the preceding chart, I have plotted the SPDR S&P Homebuilders ETF (NYSEARCA: XHB ) and spot lumber prices. A clear correlation emerges from before 2009 to around 2013. What we also see is that around 2013, while lumber prices crashed, homebuilder stocks continued onward, and more recently have even seen some gains. Generally lumber prices are thought to track the economy quite well. While many economic analysts have been bullish on the future of the US economy, commodity and bond markets have been showing for more than a year now signs of languish. A plot of corporate bond prices would show much the same thing as lumber prices in this graph, as they also have stalled starting around the beginning of 2014. More interestingly, other commodities have started to follow along in this weakening trend, with oil recently showing a spectacular fall and copper following along. Commodity markets are showing signs of warning about the future of the economy. Lumber especially has shown a historical tight relationship with the value of homebuilder stocks, and given what has happened over the past two years, we ought to be worried about the future prospects for share prices. The next plot that I have shown is the past 6 months of the relationship between lumber and XHB. (click to enlarge) What we see from this chart of the relative valuation of XHB to lumber prices is that they have traded in a relatively tight range. Starting in 2015, however, we notice a sharp spike upwards that was quickly corrected. Over the past few days this relative valuation has shot up again. Given the last swift correction in this ratio, we can probably expect homebuilders to go down in the near-term. The homebuilder rally seems to be losing steam, as the market reacted violently to this push above historical highs. Future Prospects for Timber (click to enlarge) In order to predict future movements in the price of wood, shown above is a graph of the iShares S&P Global Timber & Forestry Index Fund (NASDAQ: WOOD ). Chaikin Money Flow analysis shows strong price growth ending around the middle of September, interrupted by a strong selloff in October, corresponding quite nicely with the overall stock market. Interesting is that since then there was a brief rise in money flow, but even while this has slowed noticeably, the price appreciation has still continued. This seems like price gain without much support, and so even timber prices themselves may be unsustainable in the medium term. What is more worrying for timber prices is the state of the overall economy. Consistently low oil will likely result in slowed economic activity as oil exploration companies drastically reduce capex spending. With decreased capital spending, we can assume downward pressure on GDP growth, which is an ominous sign for timber, as well as for housing. Technical Analysis of XHB (click to enlarge) Technical analysis of XHB itself shows signs of weakness. At the end of November XHB reached a value of about 33.50, at which point momentum was lost and the stock began to fall. While XHB has been higher since then, it also has not been able to make any real progress. Volatility in XHB has drastically increased since that time, and perhaps a greater source of worry is the Chaikin Money Flow, which turned definitely negative throughout December and has not been solidly positive since then. The market seems to find the current valuation as high enough. Summary and Action to Take XHB has seen to lost momentum, as it has not been able to have a solid increase in value since the end of November. In addition, the trend of homebuilders with XHB is approaching historic highs, and this has been met with swift correction in XHB. The long term trend shows definite signs of worry, as lumber has not agreed with the high current valuation of XHB. Now would be a great time to sell any shares of XHB, as the stock is not likely to go any higher from here on. For a more speculative investment, shorting XHB would likely be a good idea. A long time horizon is probably needed for that trade to play out, though, as XHB has been able to keep this high relative valuation for more than a year now, and only time will tell how long it will be able to keep this up. In addition, if you want to play on the underlying weakness of the US economy, shorting the WOOD ETF may be the way to go. If GDP is unable to sustain itself, then timber prices will go down along with it. This is a very speculative move, however, since timber itself does not show signs of being overbought like the homebuilders. Still, timber is going to hurt if the economy slows. I still take shorting homebuilders as the safer option since not only will they fall if the economy stumbles, but they are also presently overvalued and due for a correction even if GDP does not change much. Disclosure: The author is short XHB. (More…) The author wrote this article themselves, and it expresses their own opinions. The author is not receiving compensation for it (other than from Seeking Alpha). The author has no business relationship with any company whose stock is mentioned in this article.

How Are Housing ETFs Poised For The New Year?

The housing construction market has recovered at a steady and gradual pace in the second half of 2014 after a slump at the beginning of the year. Overall economic growth, improving job numbers, growing consumer confidence, moderating home prices, stabilizing mortgage rates and a low level of housing inventory all led to the improvement. A string of housing data released lately portrays a mixed to slightly positive picture of the housing market. Existing home sales and new home sales rose in the month of October. Though housing starts declined in October and November, analysts in general believe the broader housing trends are stable to slightly positive and will pick up momentum in the New Year. Homebuilders are also turning more optimistic as demand for new homes rises with an improving job market and growing consumer confidence. Homebuilders’ confidence, as indicated by the National Association of Home Builders (NAHB)/Wells Fargo housing market index, rose 4 points to 58 in November. Though the index declined a point to 57 in December, it is still well above 50, which is the demarcating line between expanding and contracting activity levels. However, what keeps us concerned are the chances of a rise in short-term interest rates in 2015 as the Fed has already ended its six-year long quantitative easing program in October. Though the Fed had earlier promised to keep the key interest rate at record low for a ‘considerable time,’ investors are speculating about the timing of the planned rate hike. The robust job numbers might draw the Federal Reserve closer to raising interest rates. Higher interest/mortgage interest rates may have a moderating effect on housing demand and pricing. ETFs to Tap the Sector Given the improving fundamentals, the homebuilding sector deserves a closer look. For investors willing to play the space in a less risky way, an ETF approach can be a good idea. This technique can help to spread out assets among a wide variety of companies and reduce company specific risk at a very low cost. Below, we have highlighted three ETFs that are worth looking into. The SPDR Homebuilders ETF (NYSEARCA: XHB ) XHB is one of the more popular homebuilding ETFs in the market today with assets under management of around $1.48 billion and a trading volume of roughly 4.07 million shares a day. The fund has an expense ratio of 35 basis points. The fund holds 37 stocks in its basket, with 44% of the assets going to mid caps and 6% comprising large cap stocks. Despite the smaller holding pattern, the fund does not appear to be concentrated in the top 10 holdings. The fund has just 34.1% in the top 10 with Lowe’s Companies (NYSE: LOW ), Whirlpool Corporation (NYSE: WHR ) and Restoration Hardware Holdings (NYSE: RH ) occupying the top 3 positions with asset allocation of 3.64%, 3.63% and 3.56%, respectively. The fund’s assets include 33% homebuilders, 15% household appliances securities, 26% specialty retail stocks and the balance 26% building materials companies. The fund carries a Zacks Rank #3 (Hold) with a high level of risk. The iShares U.S. Home Construction ETF (NYSEARCA: ITB ) Another popular choice in the homebuilding sector is ITB, which tracks the Dow Jones U.S. Select Home Construction Index. It has $1.55 billion in assets with a trading volume of roughly 3.5 million shares a day, while its expense ratio is just 45 basis points. The fund holds 39 stocks in its basket, out of which only 12% are large cap securities. The fund has a concentrated approach in the top 10 holdings with 62.9% of the asset base invested in them. Among individual holdings, top stocks in the ETF include D.R. Horton, Inc. (NYSE: DHI ), Lennar (NYSE: LEN ) and Pulte (NYSE: PHM ) with asset allocation of 10.97%, 10.53% and 9.67%, respectively. Homebuilders accounts for around 64% of this fund. The fund carries a Zacks Rank #3 (Hold) with a high level of risk. The PowerShares Dynamic Building & Construction Portfolio ETF (NYSEARCA: PKB ) This ETF comprises around 30 housing companies and has its assets invested across all classes of the market spectrum. Engineering and construction stocks comprise 21% of the fund, followed by building materials companies that account for 17%. A look at the style pattern reveals that the fund has a preference for value stocks. The fund manages an asset base of $58.0 million and has an expense ratio of 63 basis points. The fund has only 16% in large cap securities and 46.1% in the top 10 holdings. The fund carries a Zacks Rank #3 (Hold) with a High level of risk. To Sum Up The housing market has improved dramatically from the trough year of 2009. Homebuilding activity is expected to take a cue from improving job numbers and a rebounding economy. Though the timing of a rise in interest rates creates uncertainty, homebuilders are increasingly optimistic of a pick up in sales in the New Year.