Tag Archives: nysearcavti

Tough Times For Broadly Diversified Portfolios

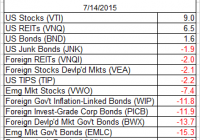
How’s your globally diversified strategy faring these days? Having a tough time? You’re not alone – the headwinds are fierce. For the first time in recent memory, the overwhelming majority of the major asset classes are in the red on a trailing one-year basis. As a result, broadly defined asset allocation strategies are suffering, at least relative to the stellar numbers in recent years. Using a set of ETF proxies for the trailing 250-day (1 year) total return, only US stocks, US REITs (real estate investment trusts), and US bonds (broadly defined) are posting gains among the major asset classes. By contrast, the other 11 asset classes are in varying states of loss over that period. Here’s another view by indexing all the ETFs to 100 as of July 16, 2014… ouch! (click to enlarge) Given the current environment, it’s no surprise that a broadly defined asset class strategy has stumbled lately. For instance, consider an ETF-based version of an unmanaged, market value weighted mix of all the major asset classes – the Global Market Index Fund, or GMI.F, which holds all the ETFs in the table above. Here’s how GMI.F stacks up for the past 250 trading days through yesterday (July 14, 2015). This investable strategy is ahead by less than 1% over that span – below the performance for US stocks (NYSEARCA: VTI ) and US bonds (NYSEARCA: BND ). (click to enlarge) Is GMI’s diminished performance surprising? Maybe, but only if you weren’t paying attention. Risk premia projections for GMI have been relatively soft for some time ( see this month’s update, for instance) – after several years of hefty gains for GMI and equivalent strategies. The lesson, of course, is that mean reversion is alive and well when it comes to market (and portfolio strategy) returns. Share this article with a colleague

VTI: Who Cares About The Middle Class?

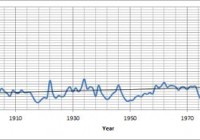
Summary New legislation that may curtail unpaid overtime has been introduced. The P/E ratio of the market is at moderately high levels but the E (earnings) relative to GDP is extremely high. A shift to higher income for labor would be a negative short term catalyst but may be necessary for long term economic health. I’m preparing for the shift by buying less broad/total market funds and more equity REITs. While the turmoil in Greece has been capturing the headlines, there are other issues that may hit much closer to home. I’ve been a fan of indexing the market and riding out the bumps through dollar cost averaging. I believe American investors can be served well by using a diversified index like the Vanguard Total Stock Market ETF (NYSEARCA: VTI ). Even as an analyst, I combine VTI with equity REIT ETFs as the major source of value in my portfolio. I believe in using the index as the main holding and attempting to build around it rather than attempting to individually pick every stock. While VTI is delivering an excellent expense ratio (.05) and excellent diversification (3827 holdings), it is still subject to market risk. I am concerned that we may be nearing a market top for the broad equity market and I am shifting my portfolio to a heavier concentration of equity REITs. Because I believe shorting the market is the game of fools, I would never recommend it. However, I do think the risk/return proposition favors equity REITs. The Middle Class There is a common refrain about the disappearing middle class. I must admit that I do believe over the next decade we may see a further increase in the gap between the “Haves” and the “Have Nots”. In my opinion, the market is far less attractive without consumers to buy the crap on the shelves. Background It helps to remember that the market can still be viewed by running numbers on the S&P 500 which makes up a very substantial portion of VTI. The following chart, built with data from multpl.com, shows the P/E ratios for the S&P 500 over a very long time frame. (click to enlarge) You might notice that we are currently right around the trend, but that is a very serious problem when we consider that earnings are exceptionally high as seen in the chart below: (click to enlarge) Corporate profits after taxes are hitting staggering values by historical measures. I believe a major factor in the high corporate profits is the introduction of more automation and a lack of intense competition in some sectors. One sign for weaker competition is buybacks. When companies are spending their cash on repurchasing shares there is an improvement in the P/E ratio and there is a fundamental increase in the shareholders ownership of the assets, but there is no increase in productivity capacity. A lack of new capacity leads to weaker competition which protects profit margins. If you need to see what high capacity and intense competition looks like, simply research companies in the mining sector. Earnings, ore prices, and share prices have fallen dramatically due to the intense competition. If corporate profits after tax were to revert to a more historically normal level as a percentage of GDP without enormous growth in GDP, it would lead to much lower earnings. Those lower earnings in turn would lead to lower share prices unless the P/E multiples increased significantly. The Headwind for Earnings The White House recently released a fact sheet on some proposed new legislation that would significantly expand the number of workers eligible for overtime pay. Nearly five million workers would be covered and this could set up quite a bit of political sparring. If nothing else changed and the companies simply paid the overtime that is currently avoided through “salaried” compensation, the simple result would be increases in labor expenses and compressed profit margins. At the same time, I would expect increased levels of sales as more money would go to middle class and lower class workers with a high propensity to consume . In short, the money would go into their pockets and then into the cash register at another establishment. Companies Won’t Agree I expect to see some fairly substantial lobbying efforts spend to fight or minimize this bill because the cost of purchasing congressmen and senators is cheaper than the cost of paying overtime to low-wage salaried employees. Was that too blunt? I’d rather get the point across clearly. The legislation is designed to raise the level of salary required to keep an employee exempt. The reason it is important for the long term health of the economy is that the current level is at less than $24,000 per year. By labeling employees as exempt, companies are able to work the employees for overtime that can drive their effective wage rate below minimum wage laws while claiming that the employees are “managers”. To the extent that this encourages companies to simply hire more employees for regular schedules, the change could be positive by improving employment rates and revitalizing a struggling middle class. However, it wouldn’t happen without pain. While the sales would be expected to increase, the weaker margins would compress earnings and I would expect share prices to fall. For VTI, that could mean share prices dropping as low as $90 in a bearish scenario (about a 15% pull back). Long Term I believe the long term implications would be very positive as it would improve employment prospects for many struggling families so a significant pull back would become a great buying opportunity. Without growth in the middle class, I think the growth in EPS from repurchasing shares may become unsustainable because earnings still depend on sales and sales still require consumers that can afford the products. In the short term, growth by repurchasing sales is fine. Over the long term, it fails to provide new productive (physical) assets that generate the wealth that we consume as humans. Seeing an end to unpaid overtime through the guise of “salaried” work would be a short term negative catalyst for stock prices, but it may be necessary for a healthy economy. I’m preparing by shifting more of my purchases into the REIT sector where I expect strong income to translate into higher average rents. I’m reducing my purchases of the broad U.S. market, to the acquisitions made by my dollar cost averaging in an automatic retirement account. How will you prepare? Disclosure: I am/we are long VTI. (More…) I wrote this article myself, and it expresses my own opinions. I am not receiving compensation for it (other than from Seeking Alpha). I have no business relationship with any company whose stock is mentioned in this article. Additional disclosure: Information in this article represents the opinion of the analyst. All statements are represented as opinions, rather than facts, and should not be construed as advice to buy or sell a security. Ratings of “outperform” and “underperform” reflect the analyst’s estimation of a divergence between the market value for a security and the price that would be appropriate given the potential for risks and returns relative to other securities. The analyst does not know your particular objectives for returns or constraints upon investing. All investors are encouraged to do their own research before making any investment decision. Information is regularly obtained from Yahoo Finance, Google Finance, and SEC Database. If Yahoo, Google, or the SEC database contained faulty or old information it could be incorporated into my analysis.

For Passive Funds, A Stronger Link Between Fees And Performance

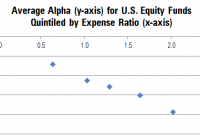
By Michael Rawson When shopping for products of unknown quality, price forms a cue that shoppers can use to differentiate products. It is often a safe assumption that a higher priced product offers better performance than a lower priced product. For instance, the Porsche 911 lists for $93,000 while the Chevy Malibu will set you back $20,000. But this is not always the case, particularly with fund investing. Unlike the Porsche, there is no cachet from buying a high-priced fund. Still, price can be useful when predicting results – though not in the way fund companies would like. Morningstar’s Analyst Rating for funds is based on five pillars: People, Parent, Process, Performance, and Price. The first three of these pillars are somewhat qualitative, while Performance and Price are much more quantitative. Price is the most tangible, both in terms of the impact of price on fund performance and comparability across funds. On average, we find that the higher the price of a fund, the worse its performance tends to be, and the link between fees and performance is stronger for passive funds. The chart below illustrates the relationship between price and performance among U.S. equity funds. It shows the average alpha (excess returns after adjusting for risk relative to the category benchmark) for all funds grouped into five quintiles by expense ratio. The y-axis shows the average alpha and the position on the x-axis indicates the average expense ratio for the group. We included all U.S. equity funds that existed five years ago and survived through today. Because some funds have performance-based fees, we used the 2009 annual report expense ratio rather than the expense ratio during the sample period. This also simulates the results of picking funds based on currently available information and examining future performance. As the chart illustrates, there appears to be an inverse relationship between fees and performance. The lowest-fee quintile has an average expense ratio of 0.64% and an average alpha of negative 0.71%, while the highest-fee quintile has an average expense ratio of 2.02% and an average excess return of negative 1.94%. However, grouping the funds into quintiles masks the tremendous variability in the relationship between fees and performance, which is better illustrated in the following graph. Here, the relationship appears much less precise. In fact, a regression of alpha on expense ratio has an R-squared of just 6%, suggesting that fees explain a small portion of the overall variability in fund performance. However, there are a few issues that may obfuscate this relationship. The chart above includes all U.S. equity funds, even though small-cap funds have higher expense ratios than large-cap funds. It also includes all available share classes despite the fact that low-cost institutional share classes must outperform high-cost retail share classes of the same fund. Also, the relationship between fees and performance might be different for active and passive funds. Because passive funds seek to match an index less fees, the relationship between fees and performance might be stronger among them. In contrast to passive funds, well-run active funds have a better chance of earning back their fees. In order to address these issues, we narrowed our focus to large-cap U.S. equity funds and removed multiple share classes of the same fund to get a cleaner read on the link between fees and strategy performance. We also grouped active and traditional broad passive funds separately and removed most niche index and strategic beta funds (index funds that make active bets in an attempt to outperform traditional indexes). The results are shown in the following chart. In this chart, the relationship between fees and performance is a bit clearer. For active funds, there is still a tremendous amount of variability, but there appear to be more dots in negative territory as we move from lower- to higher-cost funds (from left to right on the chart). Passive funds seem to hew closer to a straight line. Quantifying this relationship with a regression that expresses the expected alpha as a function of the expense ratio highlights the negative slope. For active large-cap funds, the expected alpha is approximately negative 1.21 times the expense ratio. In other words, a fund with an expense ratio 10 basis points above the average would be expected to deliver an alpha 12 basis points lower than average. While the relationship is significant, the R-squared is only 6%. Despite the poor fit of the model linking fees to performance for active large-cap funds, lower-fee funds still had a better chance of outperforming on average. This simply indicates that, while fees are predictive of performance, there are many other factors that matter. For passive large-cap funds, the R-squared is 38%. This means that there is a cleaner relationship between fees and performance for passive funds than active funds. In the sample studied, active funds in the lowest expense ratio quintile had a 28% chance of earning a positive alpha compared with just a 15% chance for those in the highest-cost quintile. But the relationship is even stronger for passive funds. About 52% of passive large-cap funds in the lowest-cost quintile earned a positive alpha (however small), while none of the funds in the highest-cost quintile did. This suggests that investors can increase their probability of success by selecting low-cost funds. Fortunately, there are a lot of low-cost passive and active funds to choose from. Vanguard Total Stock Market ETF (NYSEARCA: VTI ) holds more than 3,000 U.S. stocks and offers similar exposure to iShares Russell 3000 (NYSEARCA: IWV ) . The funds have had similar returns and risks over the past decade. However, the Vanguard fund charges 0.05% compared with 0.20% for the iShares fund. Assuming both funds return 5% annually gross of fees over 10 years, a $100,000 investment in VTI would be worth about $2,300 more at the end of the period than an investment in IWV. Among active funds, Price is one of five pillars taken into consideration in the Morningstar Analyst Rating for funds. When there are multiple funds that offer similar exposure, the lowest-cost option may be the prudent choice. Disclosure: Morningstar, Inc. licenses its indexes to institutions for a variety of reasons, including the creation of investment products and the benchmarking of existing products. When licensing indexes for the creation or benchmarking of investment products, Morningstar receives fees that are mainly based on fund assets under management. As of Sept. 30, 2012, AlphaPro Management, BlackRock Asset Management, First Asset, First Trust, Invesco, Merrill Lynch, Northern Trust, Nuveen, and Van Eck license one or more Morningstar indexes for this purpose. These investment products are not sponsored, issued, marketed, or sold by Morningstar. Morningstar does not make any representation regarding the advisability of investing in any investment product based on or benchmarked against a Morningstar index.