Tag Archives: nysearcavnq

VNQ: Take The 3.85% Yield; Duplication Is Rarely Worth It

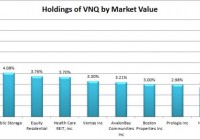
Summary I’ve been getting questions about why investors should choose VNQ over buying largest holdings within VNQ. VNQ offers substantially better diversification than investors can create by replicating the top holdings. The ETF yield is surprisingly similar to the yields across the top holdings. If an investor is committed to a plan of dollar cost averaging, VNQ offers a smart way to minimize trading costs. Vanguard REIT Index ETF (NYSEARCA: VNQ ) offers investors strong distribution yields at a rate of 3.89%. However, some investors are contemplating if they would be better off simply buying the top 5 or 10 holdings of VNQ to avoid the expense ratio and generate more income by concentrating their investments in the REITs with the highest yields. It’s a reasonable idea and it is worth some discussion. I wanted to offer a thorough response on some of the reasons that I believe investing in VNQ is superior to trying to replicate the portfolio through buying the top ten holdings. Holdings I put together a quick chart showing the recent holdings of VNQ based on their most recent market values. (click to enlarge) The top 10 holdings make up about 37% to 38% of the value of the ETF. That is a fairly substantial portion, but not substantial enough that it would make it easy to duplicate the fund by buying the top holdings. An investor that only buys the top 10 would still be missing out on a very substantial amount of diversification from the other 62% or so of the portfolio. Dividend Yields I put together a chart showing the dividend yields on each of the top 10 positions. For the convenience of readers, I kept the holdings in the same order rather than sort them by the highest dividend yields: (click to enlarge) There are certainly a few REITs in this ETF that are paying much higher yields than the main portfolio, but investors focusing on only the highest yield REITs will be putting themselves at risk for slower growth in the pay outs or more risk to the dividend itself. Higher yields are often related to higher levels of risk, so holding only the highest yielding REITs would result in a significantly higher concentration of risk. If you were to take the average yield (equally weighted) of the top 5 REITs, you would have 4.018%. If you take the average yield across the top 10, it is 3.764%. This suggests that all around VNQ is paying a fairly similar level of dividends to what an investor would expect if they focused on buying the top 5 or top 10 holdings by market value in an equally weighted portfolio. Expense ratios are fairly low The Vanguard REIT Index ETF has an expense ratio of only .12%. That does cost shareholders money compared to simply holding all of the underlying securities, but the cost is fairly low compared to the benefits. In exchange for the .12% ratio the investors are able to buy shares in a high liquid ETF with the spread is frequently one cent. On a share price that is floating around $77, that is a very attractive bid ask spread. For comparison, at the time of my checking Simon Property Group, Inc. ( SPG) had a 4 cent bid ask spread on a price around $176 (slightly better larger than VNQ), P ublic Storage (P SA) had a spread of 4 cents on a price around $187, Equity Residential ( EQR) had a spread of 1 cent on shares running around $70 (about equal to VNQ), and Health Care REIT, Inc. ( HCN) had a spread of 2 cents on a price slightly under $70. In short, the Bid-Ask spread on even the largest equity REITs is slightly worse than the spread on VNQ. Granted, if you have an indefinite holding time period the spread is only an issue when purchasing, but it does increase the cost of buying into the position. If an investor has free trading on VNQ (some brokerages do), then their trading cost to buy into positions is limited to crossing the spread. If an investor is simply doing a buy and hold with a 40 year time frame, this isn’t a huge consideration. For the investor with a 40 year time frame that is buying their REITs in one single purchase, it makes sense to replicate the fund. For an investor with a long time frame that intends to continue investing REITs by buying into their position every month or every quarter for dollar cost averaging, it would be better to take advantage of the low spreads and look for a brokerage that is offering no commissions on VNQ. Conclusion While it would be possible to generate higher yields than VNQ by picking the equity REITs with the highest yields, it would also leave an investor facing significantly more diversifiable risk. The extra income may be nice and replicating the portfolio through buying a very large volume of the securities (you’d need more than 10) would make sense for a long term investor that does not plan to be investing new money every month or every quarter. For the investor that is planning to dollar cost average into their investments and builds them up over a period of years, the purchases will be more frequent and the investor may save more on trading commissions and spreads than they lose on the expense ratio. Whether this works or not will depend on the individual investor. My dollar cost averaging strategy puts in place a minimum amount of purchasing activity for REITs, but I will occasionally add to the position when I see share prices fall. Disclosure: The author is long VNQ. (More…) The author wrote this article themselves, and it expresses their own opinions. The author is not receiving compensation for it (other than from Seeking Alpha). The author has no business relationship with any company whose stock is mentioned in this article. Additional disclosure: Information in this article represents the opinion of the analyst. All statements are represented as opinions, rather than facts, and should not be construed as advice to buy or sell a security. Ratings of “outperform” and “underperform” reflect the analyst’s estimation of a divergence between the market value for a security and the price that would be appropriate given the potential for risks and returns relative to other securities. The analyst does not know your particular objectives for returns or constraints upon investing. All investors are encouraged to do their own research before making any investment decision. Information is regularly obtained from Yahoo Finance, Google Finance, and SEC Database. If Yahoo, Google, or the SEC database contained faulty or old information it could be incorporated into my analysis.

Rate-Sensitive, Energy-Sensitive Sectors Now Down 10%-Plus

Flashy sub-segments like cyber-security and biotech continue to soar. Yet the belief that U.S. equities can stampede ahead indefinitely is sheer lunacy. Several rate-sensitive areas have already entered 10%-plus correction territory. Bullish borrowers have increased their margin debt to invest in stocks from $445 billion in January to $507 billion today. And why not? The overall price movement for growth sectors of the stock market remains healthy. Flashy sub-segments like cyber-security and biotech continue to soar. For example, I allocated a small portion of moderately aggressive client assets to the PureFunds ISE Cyber Security ETF (NYSEARCA: HACK ) in early February. Its series of higher lows since its inception lent credibility to the notion of adding dollars to the high growth, high reward area. Yet the belief that U.S. equities can stampede ahead indefinitely is sheer lunacy. Consider the reality that exports have been tumbling, labor productivity has been stalling and inventories (supply) have been rising significantly faster than sales demand. No matter how the media spin it, the economy is hurting. Now factor the economic headwinds into current and/or future corporate profits and revenue. What do you get? You come up with some of the highest price-to-sales (P/S), price-to-book (P/B) and price-to-earnings (P/E) ratios in the history of stock market valuation. Who cares, right? “Follow The Fed” advocates argue that global central banks have orchestrated exceptionally easy terms for borrowing, making bonds unattractive and stocks the only place to stash money. They maintain that modest rate increases amount to little more than moving from ultra-accommodating policy to extremely accommodating policy. Still, amateur historians might wish to recount that rate hikes in questionable economic environments (e.g., 1929, 1948, 1980) were met with recessions and stock market bears. Others might want to address the historical truth that the epic collapses of the previous decade (i.e., 2000-2002, 2007-2009) occurred alongside a Fed that had been cutting rates aggressively. Might I be more inclined to yield to a “don’t fight the Fed” reasoning if the 10-year were pushing 1%? I imagine I would be buying the harsh pullback that likely occurred along the way. If the 10-year were hugging 2%? I might expect stocks to hold serve. In contrast, the higher the 10-year climbs due to fears of an imminent tightening campaign, the more likely rate-sensitive stock assets will drag the broader market downward. Remember, the S&P 500 has not witnessed a 10% correction in roughly four years. On the other hand, several rate-sensitive areas have already entered 10%-plus correction territory. Real estate investment trusts in the Vanguard REIT Index ETF (NYSEARCA: VNQ ) are off -11.4%, while utilities in the SPDR S&P Sector Select Utilities have dropped -13.2%. The hardship in the energy arena has been equally challenging. Broad-based energy corporations in the Energy Select Sector SPDR ETF (NYSEARCA: XLE ) may be well off their March lows, but the influential sector fund is still down a bearish -21% from a 2014 pinnacle. Similarly, the JPMorgan Alerian MLP Index ETN (NYSEARCA: AMJ ) – hit by the double whammy of rising yields and price depreciation in crude/natural gas – currently resides in a bear cave with a -21.5% decline. Even the transporters in the iShares Transportation Average ETF (NYSEARCA: IYT ) has witnessed intra-day depreciation of -11.5%; the current price of IYT is also below a long-term 200-day moving average. For the record, I believe the bond rout is closer to running its course than marching forward. There is not much technical support for my belief, other than oversold Relative Strength Index (RSI) indications. Support for the 10-year Treasury in and around 2.5% may even be a decent entry point for government bond investors. Consider the iShares 7-10 Year Treasury Bond ETF (NYSEARCA: IEF ). The U.S. 10-year is trading 10 basis points lower at 2.4% on Thursday. If you had a choice between owning Spain’s 10-year sovereign debt at 2.1%, Germany’s 10-year bund at 0.9%, or the U.S. 10-year at 2.4%, which would you choose? (Note: I recognize that many would choose “None of the Above.” Nevertheless, foreign investors, pension funds and central banks all require government debt; the supply is limited. The dramatic taper tantrum in bonds that occurred in 2013 reversed itself in 2014. Similarly, the bond rout to this point in 2015 is likely to see a sharp reversal in the 2nd half of 2015 or in early 2016.) On the whole, depending on the client, cash levels have been raised to 10%-25%. I have lowered stock and fixed income exposure due to the execution of stop-limit loss orders as well as the elevated correlations across asset classes; the elevated correlations make it particularly difficult to protect portfolios with traditional diversification. In contrast, a tactical asset allocation decision to raise cash makes it possible to acquire shares of stock or bond ETFs at lower prices in the future. Disclosure: Gary Gordon, MS, CFP is the president of Pacific Park Financial, Inc., a Registered Investment Adviser with the SEC. Gary Gordon, Pacific Park Financial, Inc, and/or its clients may hold positions in the ETFs, mutual funds, and/or any investment asset mentioned above. The commentary does not constitute individualized investment advice. The opinions offered herein are not personalized recommendations to buy, sell or hold securities. At times, issuers of exchange-traded products compensate Pacific Park Financial, Inc. or its subsidiaries for advertising at the ETF Expert web site. ETF Expert content is created independently of any advertising relationships.

VNQ: A REIT ETF Worthy Of My Portfolio

Summary VNQ offers investors the full package of benefits I’m looking for. The ETF is offering excellent correlation benefits to SPY, low expense ratios, and great liquidity. REIT ETF’s generally offer very strong dividend yields. I’m not seeing any reason not to use VNQ. Investors should be seeking to improve their risk adjusted returns. I’m a big fan of using ETFs to achieve the risk adjusted returns relative to the portfolios that a normal investor can generate for themselves after trading costs. I’m working on building a new portfolio and I’m going to be analyzing several of the ETFs that I am considering for my personal portfolio. One of the funds that I’m considering is the Vanguard REIT Index Fund ETF (NYSEARCA: VNQ ). I’ll be performing a substantial portion of my analysis along the lines of modern portfolio theory, so my goal is to find ways to minimize costs while achieving diversification to reduce my risk level. What does VNQ do? VNQ attempts to track the total return (before fees and expenses) of the MSCI U.S. REIT Index. Substantially all of the assets are invested in funds included in this index. VNQ falls under the category of “Real Estate”. Does VNQ provide diversification benefits to a portfolio? Each investor may hold a different portfolio, but I use the SPDR S&P 500 Trust ETF (NYSEARCA: SPY ) as the basis for my analysis. I believe SPY, or another large cap U.S. fund with similar properties, represents the reasonable first step for many investors designing an ETF portfolio. Therefore, I start my diversification analysis by seeing how it works with SPY. I start with an ANOVA table: (click to enlarge) The correlation is just under 66%. That’s a very solid level of correlation and not unusual for comparing a REIT index to SPY. As an investor using modern portfolio theory, I’m happy with seeing that level of correlation. Of course, the value low correlation wouldn’t mean much if the values were being distorted by poor liquidity. The average volume of nearly 5 million shares per day suggests that liquidity shouldn’t be a concern. That’s a good sign for investors wanting verification of the statistics or wanting to know that they can exit the position with less concern about it deviating from NAV. Standard deviation of daily returns (dividend adjusted, measured since November 2013) The standard deviation is fairly reasonable. For VNQ it is .843%. For SPY, it is 0.736% for the same period. The ETF is definitely showing more volatility than SPY by a noticeable margin when we compare returns on a daily basis. Given the low correlation, it should still improve the risk profile of the portfolio. Mixing it with SPY I run comparisons on the standard deviation of daily returns for the portfolio assuming that the portfolio is combined with the S&P 500. For research, I assume daily rebalancing because it dramatically simplifies the math. With a 50/50 weighting in a portfolio holding only SPY and VNQ, the standard deviation of daily returns across the entire portfolio is 0.719%. With 80% in SPY and 20% in VNQ, the standard deviation of the portfolio would have been .711%. If an investor wanted to use VNQ as a supplement to their portfolio, the standard deviation across the portfolio with 95% in SPY and 5% in VNQ would have been .727%. In each scenario, the overall portfolio has less volatility than SPY. I am leaning towards running REITs in my portfolio as 10 to 20% of the total portfolio. Why I use standard deviation of daily returns I don’t believe historical returns have predictive power for future returns, but I do believe historical values for standard deviations of returns relative to other ETFs have some predictive power on future risks and correlations. Yield & Taxes The distribution yield is 3.60%. I like to see strong yields for retiring portfolios because I don’t want to touch the principal. By investing in ETFs I’m removing some of the human emotions, such as panic. Higher yields imply lower growth rates (without reinvestment) over the long term, but that is an acceptable trade off in my opinion. The ETF is composed of REITs, so investors concerned about the taxation impacts of investing in a REIT ETF should seek tax advice from a qualified professional. Expense Ratio The ETF is posting an expense ratio of .10%. I want diversification, I want stability, and I don’t want to pay for them. An expense ratio of .10% is absolutely beautiful and extremely attractive for an ETF that is also offering low correlation to SPY, strong yields, and great liquidity. Market to NAV The ETF is at a .05% discount to NAV currently. Premiums or discounts to NAV can change very quickly so investors should check prior to putting in an order. Generally speaking, that discount to NAV isn’t big enough to be a big deal. However, even a small discount to NAV is fairly attractive when we are talking about a high quality ETF. In my opinion, this is easily one of the most attractive ETFs I have examined. Largest Holdings The diversification in the holdings isn’t going to be a strong selling point. Nothing against Simon Property Group (NYSE: SPG ), but over 8% in the position is pretty big. Given that the expense ratio is .10%, I think that offsets the relatively mediocre level of diversification within the positions. The other individual companies that are making up the top several sections all have different exposures, such as self-storage, multi-family housing, and health care. (click to enlarge) Conclusion The combination of correlation, liquidity, and yield makes a great investment for investors that want to reduce the overall volatility of their portfolio without having their capital tied up in investments that can be difficult to exit. For investors looking at the very long term picture, the extremely low expense ratio is beautiful. Vanguard and Schwab have provided some ETFs with very low expense ratios. I don’t think an ETF should be chosen purely for the expense ratio, but I do believe investors should be very aware of it. When I’m putting together hypothetical portfolio positions, one of the things I include is the expense ratio of the ETFs to track the overall expense ratio on the portfolio. In trying to find anything wrong with the ETF, the biggest weaknesses would probably be the size of the position in SPG and the fact that it is market weighted. However, most ETFs are market weighted. Most ETFs also have enough weaknesses that I can easily spot at least something wrong. In the case of VNQ, the market cap issue is offset by the fund having a turnover ratio of only 11%. I’ve had a preference for Schwab funds because I have an account that can trade them for free. However, I also have some significant tax exempt accounts with other brokerages. I’m strongly considering VNQ for a position in my IRA. Got a different opinion? An argument for why I shouldn’t invest in VNQ? Let’s hear it in the comments. Additional disclosure: Information in this article represents the opinion of the analyst. All statements are represented as opinions, rather than facts, and should not be construed as advice to buy or sell a security. Ratings of “outperform” and “underperform” reflect the analyst’s estimation of a divergence between the market value for a security and the price that would be appropriate given the potential for risks and returns relative to other securities. The analyst does not know your particular objectives for returns or constraints upon investing. All investors are encouraged to do their own research before making any investment decision. Information is regularly obtained from Yahoo Finance, Google Finance, and SEC Database. If Yahoo, Google, or the SEC database contained faulty or old information it could be incorporated into my analysis. The analyst holds a diversified portfolio including mutual funds or index funds which may include a small long exposure to the stock.