Tag Archives: nysearcauvxy

Why I Am Hedging My Portfolio With UVXY

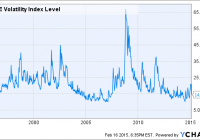
Summary The stock market is hovering near all time highs. The current bull market at 6 years is approaching the historical average. The VIX Index has not closed a month over 30 in more than 3 years. I usually stay away from investments that do not have tangible asset backing, but I have made an exception in the case of the Pro Shares Ultra VIX Short Term ETF (NYSEARCA: UVXY ). Perfect Portfolio Insurance What exactly is UVXY? According to its prospectus on the Pro Shares website, it seeks daily investment results that correspond to 2x the daily performance of the S&P 500 VIX Short-Term Futures Index. What this basically means is that this ETF rises and falls with the level of the VIX, which is more commonly referred to as “The Fear Index.” With general market levels at all time highs, there is not much fear permeating today’s business landscape. However, as market historians have learned time and again, fear is one of the most powerful human emotions, and can skyrocket at a moment’s notice. Let’s look at some of the possible reasons why the VIX could increase dramatically in the near future. The VIX Is Below Its 20-Year Averages Take a look at the following 20 year chart for the VIX: ^VIX data by YCharts As you can see, the VIX hasn’t closed a month above 30 since November of 2011, over 3 years ago. The VIX has risen to 30 or above on 10 different occasions throughout the past two decades, leaving us with an average of one spike above 30 every two years. The longest time the VIX remained below 30 was 3/31/03-9/30/08, a period of 5.5 years. Although this was a long wait, the VIX jumped all the way to its 20 year high of over 65 shortly thereafter. An era of low fear can only exist for so long in the volatile world of the stock market. This current run of low VIX readings is the second longest of the past two decades, and the longer that it continues, the higher the probability of a spike, based on historic averages. The Current Bull Market Is Almost 6 Years Old As a student of the stock market, I am fascinated by the bull and bear trends that are the fabric of investing. Although hindsight is always 20/20 in the stock market, the current trend is approaching the historical average bull market length. The longer that the market keeps running, the harder the inevitable fall will become. Since the 1950s, there have been 9 bear markets , which are defined as a drop in the S&P 500 by 20% or more from its high point. That leaves us with roughly one bear market every 6.5 years. The current bull market began in March 2009, which makes it almost 6 years old. The longer that this bull market runs past its historical average, the higher the likelihood that it will sell off and become a bear market. Current Statistics Indicate An Overvalued Market I’d love to say that I can predict exactly when the correction will happen, but I know that is a fool’s errand. I just know that the longer a trend continues in the stock market, the more people believe it to be true, which is ultimately when the sentiment changes. Robert Shiller, a renowned economist, created the Cyclically Adjusted Price-Earnings (CAPE) ratio in an effort to create a gauge of how expensive the current market is. It is tallied by dividing price by the 10 year moving average of earnings, adjusted for inflation. Check out the following historical CAPE chart for the S&P 500: S&P 500 Cyclically Adjusted Price-Earnings Ratio data by YCharts As you can see, we are currently at the same level that we were at during the peak of the 2008 market, and just under the level of the infamous 1929 crescendo. This does not mean that a crash is imminent, but it does mean that we are entering dangerous waters. Another tell tale sign of a roaring bull market is high speculation on margin. This chart shows an eerie correlation between stock prices and margin levels: (click to enlarge) Source: Business Insider As the famous Mark Twain quote goes, “history doesn’t repeat itself, but it does rhyme.” As stock prices keep increasing, people become more confident, and overextend themselves. It is a reality of the stock market today. Unless we are truly entering a fairy tale era of high margin speculation and never ending growth, this trend has to reverse itself eventually. Other Considerations The Federal Reserve has officially ended its unprecedented QE program, which has been the largest economic stimulus in world history. This is important because it is now only a matter of time before the Fed raises interest rates. It will be fascinating to see how the financial markets react to the inevitable rate hike. This will negatively impact earnings for thousands of companies that rely on borrowed money. When this happens, volatility will spike. From a macro perspective, it is a harsh reality that there is a tremendous amount of uncertainty in the world today. With Greece teetering on the edge of default and ISIS being in the news almost daily, there is high potential for a negative trigger sometime in the near future. Unfortunately, subprime lending is making a comeback and student loan debt is burdening an entire generation, causing first time home buyer rates to drop to 30 year lows . As the student loan generation ages, they will have less disposable income to spend, and thus will impact the revenues of many companies. All of these are potential catalysts that could trigger a long overdue negative reaction in the stock markets. Why Choose A Leveraged Fund? The reason I chose a leveraged ETF like UVXY rather than a standard futures ETF like the iPath S&P 500 VIX Short Term Futures ETF (NYSEARCA: VXX ) is simple: a strong conviction that the facts mentioned above will contribute to a market volatility higher than current levels in the near future. UVXY attempts to return 2x the VIX’s performance for that particular day. This means that when a spike in volatility occurs, UVXY will significantly outperform VXX, which only attempts to achieve 1x the VIX performance. Although UVXY will decline more than VXX in a low volatility market, the increased profit potential outweighs that drawback in my opinion. Risks There is one dominant risk concerning this strategy: the structure of UVXY itself. UVXY is a leveraged futures ETF, which means that it suffers exponential decay when in a period of contango. Contango is when the futures price is more expensive than the current spot price. Unfortunately, in a low volatility market like the present one, UVXY is in contango the majority of the time. Accordingly, the risk of holding UVXY for a long period of time should be obvious. It WILL lose money if the market keeps up its slow ascent and fear fails to materialize. However, history shows us that record high stock prices and low volatility cannot go on indefinitely. It is of utmost importance to exit a position in UVXY as soon as the VIX spikes in a significant way. Why is this? Because fear is a much stronger emotion than greed, but lasts for a much shorter time, which makes the spikes that much more pronounced. Accordingly, fear can vanish in an instant, so huge gains in a vehicle like UVXY can vanish in the blink of an eye. Conclusion Although the near future in stocks may continue to be bright, I believe that preparing for the worst is always a good strategy. As a holder of equities, I am hoping that the stock market continues its upward trend, but I will be prepared if it does not. I consider the decay of UVXY the monthly premium that I pay in order to hold insurance in the case of disaster. If any of the aforementioned negative triggers materialize, UVXY should increase in value, which will then allow me to add to my long positions at lower prices. As Warren Buffett is famously quoted: “Only when the tide goes out do you realize who’s been swimming naked.” All I know is that when the wave of fear hits, at least I’ll have my bathing suit on. Disclosure: The author is long UVXY. (More…) The author wrote this article themselves, and it expresses their own opinions. The author is not receiving compensation for it (other than from Seeking Alpha). The author has no business relationship with any company whose stock is mentioned in this article.
The VIX: What It Is, What It Isn’t, What To Do About It Now

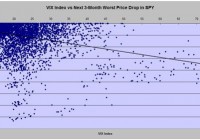
Summary Widely regarded as the “fear factor” forecaster of stock market price declines, it has an irregular, unreliable pattern of prophecy. Perversely, it is a much more reliable forecaster of general market index recovery. What should we believe it is telling now? How best to profit from its ODDS and PAYOFFS of prior outcomes? Where the VIX comes from The basic equation of stock option valuation contains several interrelated factors, including the underlying stock’s price, which when solved provides an appropriate price for each of the several available strike-price and expiration-dated option contracts. One of the key input factors common to all the contract price solutions is the issue of uncertainty present for the underlying stock’s future price. From the start of trading in listed stock options over 40 years ago, options traders turned the contract pricing formula around and accepted the market’s options trading prices as inputs, in place of the uncertainty component of the equation, and solved for the stock’s “implied volatility.” Traders discovered that the degree of “implied vol” for each stock tended to have a usual level of uncertainty across time, and being aware of current variances from its norm, provided them with profitable trading insights into future prices. By applying this approach to options on a market index, the Chicago Board Options Exchange [CBOE] in 1983 devised and copyrighted the term VIX to designate an index measure of the S&P 500’s implied volatility. The VIX Index is quoted in percentage points and represents roughly the (thus derived) expectations of potential change of the S&P 500 in the next 30 days. Direction of change is not indicated. If it’s a Fear Index, why does that matter? That should be obvious, but let’s test it out. We go to a reliable, available source for data, like Yahoo Finance, and obtain all the available daily data history for the VIX Index (since 1/2/1990) and for something appropriate that we can easily trade, like the SPDR S&P 500 Fund ETF (NYSEARCA: SPY ). It is available from 1/29/1993, downloaded in .csv (comma separated values) for easy use in a spreadsheet tool like Excel. There are well over 5,000 days of data to use, over ten years worth, plenty to offer statistically reliable inferences. Matching up the dates from the two data sets, we calculate what has been the worst possible price change for SPY in the coming 3 months after each day, and compare that with the VIX Index value at the initial date. Figure 1 shows what we get. Figure 1 (click to enlarge) The VIX Index in these 11 years never got much below 10, and days measuring above 30 start to get sparse. Much of the time between its 10 to 15 value looks to be completely random. There the worst next-3-month market declines are concentrated around -5% to -7%. Days with VIX above 15 start to see a shower of more substantial declines, plus a lot of the less than -5% kind. The best-fit line confirms the general relationship of higher index numbers with larger market declines. But the far fewer large outliers seem to dictate the fit relationship, compared to scads of close-in, small-scale comparisons. Just to be fair, let’s look at the other side of the coin: What were the market’s best days in the next 3 months, compared to the “fear-factor” advance warning? Check out Figure 2. Figure 2 (click to enlarge) This looks strangely like a mirror of Figure 1’s market moves to the downside, hinged along the zero% change line. Now the relationship line shows increasing market price gains as the VIX Index is higher. Where the index is small, the level of determination is small to any degree of specificity. Figure 2’s contrast with Figure 1 demands some more inclusive measure of the usefulness of the VIX as a forecaster of coming market behavior. In Figure 3, we attempt this by relating the index levels to a fixed holding period price change in SPY. Our first effort, using 3 months as a test period does not provide any motivation to believe that a longer or shorter holding would create much difference. Figure 3 (click to enlarge) VIX Index values over a long period of observations have proven by themselves to be a truly rotten forecaster of likely subsequent market price changes, either to the downside, the upside, or simply on average. Figure 3 has a relationship line basically independent, one of the other. One encouraging thing about this is that the presence of the VIX Index may have helped keep the market balanced, as evidenced by there being no sign of a pattern of advantage created by the presence of this sophisticated analytical measure. Its early benefits, if any, were quickly arbitraged away by astute observers. Inherent in the nature of the VIX Index’s creation is that it tries to define uncertainty, rather than differences of value from some norm or standard. The statistics involved can identify levels of uncertainty, but lack any useful directional sense in their derivation. When the game changed In early 2006, options on the VIX Index (VIX) itself were listed by the CBOE and began trading on a daily basis. That permitted us to show what the market’s own actions have as a forecast of this presumed market forecaster. But now dimensions of price change direction now are being shown, when the means of making such forecasts are known, as we do using behavioral analysis principles. What are today’s directional indications for the VIX? Figure 4 presents this past Friday’s closing-prices-based forecast for the VIX Index in its most right-hand vertical bar. It represents a range of that index’s potential market quotes in coming days, weeks, and few months. Figure 4 (used with permission) Readers of our Intelligent Behavior Analysis articles on Seeking Alpha are familiar with the measure we use to identify likely directional emphasis resulting from the analysis. We term our measure the Range Index [RI], calculated from the price range being forecast by the analysis of the investment subject. It indicates what proportion of the whole range lay downward from the current price. In Figure 4, the RI of the VIX is 7. That means 93% of the forecast range is to the upside, a typically strong condition. With a current market quote of $14.30 for the VIX and an upside limit to the range of $18.82, a rise in price by +31.6% is viewed as likely enough to be possible that parties becoming at risk to changes in its price are willing to pay for protection against the change, should it happen. The possibility of a complementary price decline works out to a -2.5% change. At these extremes, there is about a 13-to-1 prospect of advantage on the “reward” side over the “risk” exposure (of a bet on the VIX). We have devised a simple, but powerful, investment portfolio management discipline that functions very effectively using this kind of information. We use it as a standard of behavior to compare the investment desirability of virtually all of the roughly 3,500 equity securities examined daily. Applied to the VIX, its results appear in the row of data between the two blue-background pictures of Figure 4. The results are that in the 124 prior instances of the 1,261 market days in the last 5 years where a 7 RI of the VIX occurred, 76% of them were profitable experiences. The net gains in all 124 earned +24% gains in average holding periods of 36 market days, which would have produced an average annual rate of return of +355%. If the VIX were a security that could be bought and sold, most likely this would be a good point in time and price to buy it. But the VIX is an index that cannot be bought or sold as a security. There are, however, ETFs that are based on movements of the VIX Index that can be traded conventionally. Ready to get confused? This is where two logical inversions take hold of the task of making money from what can be known about the VIX, its dependent ETFs, and the market as evidenced by the S&P 500 Index, or SPY. The first inversion comes from investors’ normal association with being “long” in assets that rise sympathetically when the “market” goes up. The “price” of the VIX is a measure that rises when the market unexpectedly goes down, reflecting increasing investor uncertainty. And uncertainty is what the VIX measures. So, when market prices go down, VIX Index goes up. The second inversion comes from investors’ usual attempts to find forecasting tools that will anticipate market moves, allowing them to position themselves to be drawn along by or accentuated by the market’s investing gravity. As we showed in our prior article about the VIX, the sequence is reversed here. It is the market’s actions that forecast subsequent VIX-related price moves, not the other way around. Then there is simply a complexity in that the ETFs related to the VIX are most directly denominated not by the VIX Index itself, but by the prices of futures contracts on the index. While there are logical parallels, each security has its own markets, with frequent individual local influences that may obfuscate otherwise reasonable expectations. Arbitrage here is not a game for the casual practitioner or the dilettante. The array of ETPs at hand includes: iPath S&P 500 VIX Short-Term Futures ETN (NYSEARCA: VXX ) ProShares VIX Short-Term Futures ETF (NYSEARCA: VIXY ) ProShares VIX Mid-Term Futures ETF (NYSEARCA: VIXM ) VelocityShares VIX Short-Term ETN (NASDAQ: VIIX ) ProShares Ultra VIX Short-Term Futures ETF (NYSEARCA: UVXY ) ProShares Short VIX Short-Term Futures ETF (NYSEARCA: SVXY ) Their MM forecasts and forecast history details are in Figure 5. Figure 5 (click to enlarge) Remember please that the orientation of this data is from having or taking a long position in the designated security. All except SVXY are expected to go up in price when the S&P 500 goes down meaningfully. SVXY, being a security that is short its VIX futures holdings, should rise when the VIX futures go down. Further, all of the historical data (in columns 6 and 8-15) is from the standard portfolio management discipline applied to prior appearances of forecasts with upside to downside balances like today’s, as indicated in column (7). Tomorrow or a week from now, these balances are likely to be different, and if so, decisions at that time need fresh historical backgrounds. But at this point, the attractiveness of a long-position bet in each is ranked by the figure of merit in column (15). It attempts to blend odds of profitability with win-loss ratios and frequency of prior opportunities specific to each issue under conditions like the present. Conclusion On this basis, the VIX Index itself is the best bet, but one not directly placeable. Certainly, the efforts of Greeks and the EU keep the VIX uncertainty pot boiling. The implication is that the S&P 500 Index is likely to encounter a decline in the next 3 months, significant enough to pop the VIX from 14+ to near 19. But the cost of making that bet through VIX futures is already priced high enough that the odds of making money at it are less than a coin-flip and as little as one in 8 or one in 12. The sole exception to such a dismal proposition is that over the course of the coming 3 months, the S&P is seen likely to rise sufficiently to generate a profit in SVXY from here in nearly 8 out of 10 tries. In the past, such propositions (43 market days out of the nearly 3 years of that ETF’s existence) have generated net gains of over 8% in less than 6 weeks of average position holding times for a +98% annual rate of gain. Now, that’s pretty attractive. But there is a possibly better strategy than just buying SVXY here. If the market pros who daily express their views about the near future of the S&P 500 via hedging in the index futures markets are right and the VIX odds say they are right 3 out of 4 times (76 out of 100), the SPX and the SPY are likely at that new lower point of the S&P 500 to be supporting an even better (lower) buying price on SVXY than it now has. Many variations of action implementation can be imagined. Disclosure: The author has no positions in any stocks mentioned, and no plans to initiate any positions within the next 72 hours. (More…) The author wrote this article themselves, and it expresses their own opinions. The author is not receiving compensation for it (other than from Seeking Alpha). The author has no business relationship with any company whose stock is mentioned in this article.