Tag Archives: nysearcauso

USO: Don’t Be Fooled By Minor Corrections

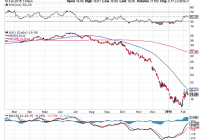
Summary After months of straight declines, oil prices seemed to bounce back starting in February. An increase in the RSI, though encouraging, is still not indicative of a broader correction. The 50-day moving average seems to be a resistance line. Oil production is still increasing. Since topping around June, oil prices have been in a steady and precipitous decline. Though the reasons have been speculated upon (mainly the debate is whether this is caused by low demand or high inventory), what is more important for speculators in the oil market is where prices are going. Around the beginning of February, prices have reversed their long and persistent decline by finally showing a rally. While this gives hope to many investors, especially those who bought oil companies hoping for a quick recovery, there are signs that there is still more pain to come. RSI and Technical Expectations (click to enlarge) To follow oil prices and technical indicators, I have shown a chart of the United States Oil Fund (NYSEARCA: USO ). A clear downtrend is apparent starting in June and continuing all the way to January. Since last month, the decline slowed noticeably, and starting in February, there is a decent correction forming. While the recent price increase is a case for optimism, a closer analysis reveals that the bear market may not be hibernating quite yet. Firstly, in bear markets, RSI tends to oscillate between 10 and 60. RSI is currently at around 50, and for real hope that this market is over, a value over 60 has to be there. Secondly, the most recent prices are showing that the 50-day moving average is unable to be surpassed, as USO hit that value, but then retraced after touching it. That said, a breakout is still possible, but with RSI hitting a wall below 60 and the price retracing at the 50-day moving average, the bear market is still well in place. Minor corrections are a part of bear markets, and this minor correction seems like exactly that, not a breakout. Fundamental Expectations The biggest factor that analysts are looking at right now is oil production. Once production finally decreases, we may then finally see the price of oil increase. While rig count can give a clue about production, it is not itself production, and production can still increase while rig counts are falling. Thus, the recent analysis by Citigroup ought to be concerning for any oil investors. It recently stated that: Despite global declines in spending that have driven up oil prices in recent weeks, oil production in the U.S. is still rising, wrote Edward Morse, Citigroup’s global head of commodity research. Brazil and Russia are pumping oil at record levels, and Saudi Arabia, Iraq and Iran have been fighting to maintain their market share by cutting prices to Asia. The market is oversupplied, and storage tanks are topping out. The same article noted that prices could fall as low as $20 per barrel. Clearly, these analysts are not buying this recent correction, nor should you. The low prices are here, and they are not going anywhere quite yet. Should We Trust Citigroup’s Analysis The question then becomes whether Citigroup is offering valid analysis, or is simply trying to change market sentiment to its benefit. To answer this question, I looked at the U.S. Field Production of Crude Oil offered by the EIA. (click to enlarge) The large increase in production since 2010 is obvious. The question now is whether US producers have taken steps to cut production now that oil prices have fallen so dramatically. To this end, a graph of year-over-year changes in production is shown. (click to enlarge) Clearly up to the latest data taken, no slowdown is found. In fact, not even a loss of momentum is apparently present. Production is increasing as quickly as it ever has, and based on this data, production is still not declining. December and January may show changes, but clearly the oil industry has a long way to go if production is going to be significantly cut in response to oil prices. Summary and Action to Take Oil is definitely not for the faint of heart right now. While I am uncertain about whether prices will actually fall to $20, I am fairly confident that oil prices are not poised for a sustainable rise quite yet. I would stick clear of USO for now, though outright shorting seems like an excessively risky move. Conversely, now would be a great time to load up on oil companies that are well poised to weather this low price environment. The way I would do this is with companies that have low debt and a good coverage ratio on their dividend. Helmerich & Payne (NYSE: HP ) is a great way to play a future correction, as it has very low debt and a current yield above 4%. There are other great companies to play the correction, though even staying put would be apt until we see further evidence that prices should rise. I would wait until production starts to decrease before investing in USO. Disclosure: The author is long HP. (More…) The author wrote this article themselves, and it expresses their own opinions. The author is not receiving compensation for it (other than from Seeking Alpha). The author has no business relationship with any company whose stock is mentioned in this article.
Materials ETFs Mauled By Falling Oil Prices

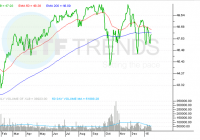
Summary Energy prices are falling. Low oil prices are weighing on the materials sector. Materials are experiencing lower activity on energy fallout. Oil’s slide has identified some winners at the sector level, namely consumer-related shares, but beyond the energy sector, there are some losers as well. Those losers include the materials sector, which was already scuffling heading into 2015. Last year, the Materials Select Sector SPDR ETF (NYSEARCA: XLB ) rose just 7.2%, including paid dividends. XLB’s 2014 showing was 630 basis points worse than the S&P 500, and enough to make the fund the second-worst of the nine sector SPDR ETFs, behind only the Energy Select Sector SPDR ETF (NYSEARCA: XLE ) . To this point in the new year, only three of the nine sector SPDRs have traded higher. XLB is not a member of that trio. In theory, materials stocks should be winner in a low energy price environment, because lower oil and gas prices reduce input costs for energy-intensive materials producers and chemicals manufacturers. In reality, that has not been the case. While the materials sector’s earnings warnings have not yet reached alarming heights, it is clear oil’s plunge is taking a toll on the sector. Of XLB’s top 10 holdings, a group that combines to make up about two-thirds of the ETF’s weight, only three have traded higher to start 2015. “The investment markets reflect these winners and losers in the economy. Consumer driven sectors of the market have performed quite well. The energy and commodity sectors of the market have not. Between oil stocks, the materials sector, and industrial and utility names in commodity-related businesses, roughly 20 percent of the S&P 500 is a loser with falling oil prices.” – Jones & Associates LyondellBasell Industries (NYSE: LYB ), one of XLB’s top 10 holdings, said that in the fourth quarter low oil prices will damp its margins. That after the company helped materials ETFs perform well in the first half of 2014 on the back of rising crude prices . A recent Morgan Stanley report highlighted PPG Industries (NYSE: PPG ), a top 10 holding in XLB, as one materials name that could endure lower oil prices, but the bank also identified Eastman Chemical (NYSE: EMN ), LyondellBasell and Dow Chemical as potentially challenged by lower oil prices. Those stocks combine to make up over 16% of XLB’s weight. XLB’s five-year correlation to The United States Oil ETF (NYSEARCA: USO ) is over 59%, according to State Street data . Materials Select Sector SPDR ETF (click to enlarge)

Any Hope For A Gold And Oil ETF Rebound In 2015?

Gold and oil were the two most-talked-about commodities last year thanks to their awful performances. These two widely-followed commodities witnessed dire trading in 2014 with the latter being thrashed heavily by the strength of the greenback, demand-supply imbalances, and cooling geo-political tension in the second half of the year. While muted global inflation, reduced demand from key consuming nations like China and India restricted the yellow metal’s northward ride, the return of worries in the Euro zone, and poor data points from Japan and China have made oil more diluted. As a result, oil prices plummeted more than 50% in 2014 and gold registered the first consecutive annual decline last year since 2000 . Some are also worried that the slump could continue as the Fed is now on its way to hike the key rate this year. The Fed’s step strengthened the dollar and in turn marred commodity investing. Great Start to New Year for Gold Having lost more than 8% in the last six months, SPDR Gold Trust ETF (NYSEARCA: GLD ) bounced back to start the New Year gaining about 2% in the last two trading sessions as of (January 5, 2014). So, did the biggest gold mining fund, Market Vectors Gold Miners ETF (NYSEARCA: GDX ) , which has added about 5.8% during the same phase. Gold miners – which often trade as leveraged plays on gold – delivered two successive years of negative performances losing about 50% in 2013 and 16% in 2014. A sagging stock market and worries over Greece political crisis indicating the nation’s likely way out of the Euro area bolstered the safe-haven appeal of gold to start this year. As a result, gold bullion crossed the $1,200/ounce mark after a few months. In such a situation, investors might want to know the upcoming course of gold related ETFs. We do not expect the latest uptrend to last long. Most of the macroeconomic indicators that went against gold prices last year like the Fed policy, strong U.S. dollar and deflationary spell, will nothing but intensify this year. GLD is trading a little below its 200-day simple moving average but higher than 50 and 9-day simple moving averages which signify long-term bearishness for the ETF. The biggest fund in the space, GLD, is yet to enter the oversold territory as depicted from the above chart. The ETF is trading at a Relative Strength Index (RSI) value of 53.48 indicating there is room for further erosion in the price once the risk-off sentiments drop out of sight. The trend was similar for GDX too with current price trading below long-term averages and above the short-and-medium term averages. Its RSI value stands at 56.54. In a nutshell, miners will likely follow the underlying metal’s direction, obviously with higher magnitude, this year. Overall, the gold mining space will likely see a mixed 2015 and will be busy paring down losses incurred last year. Investors interested to bet on gold should follow the space closely as it is expected to be on a roller coaster ride this year. No New Year Party for Oil Unlike gold, there was no celebration for oil this New Year. WTI crude prices are now below $50, marking a massive slide from their level a year ago. Needless to say, this was a new multi-year low. Persistent supply glut, no production cut by OPEC as well as the U.S. will keep the space under pressure. United States Oil Fund ( USO ) is trading a little below long, medium and short-term moving averages which signifies utter bearishness for the product. In fact, it seems as though oil does not have any driver which can revive it in the near term. However, the product is presently trading at a RSI value of 22.53 indicating that it slipped into oversold territory and might change its course soon after hitting a bottom. Per barrons.com , Citigroup’s commodity group cautioned about a frustrating 2015 for oil and slashed its oil-price forecast for this year and the next to even lower than its most bearish prior estimates. Citi cuts price expectation for WTI crude from $72/barrel to $55 in 2015 while Brent oil price expectation has been reduced to $63 a barrel from $80 a barrel. Bottom Line In short, 2015 should not be great for both commodities and the related ETFs barring some occasional spikes which can be defined as a correction. Investors dying to look for a sustained trend reversal in these commodities, should wait for a big Chinese and Euro zone stimulus, which may bolster the regions’ waning manufacturing industry spurring the usage of oil and goading investors to buy more gold (notably, China is the world’s largest consumer of the yellow metal). Investors should also look out for a pull back in oil production and the return of geo-political tensions. As far as the Fed rate hike is concerned, we believe that the most of it has been priced in at the current level, suggesting that either way, it will be another interesting year for oil and gold.