Tag Archives: nysearcaupro

A Simple SPY Top-Off Portfolio

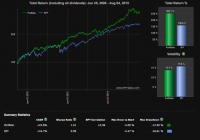
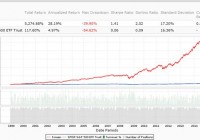
Summary A one-third UPRO, two-thirds cash portfolio mimics SPY (with some small tracking error and a net 0.32% expense ratio). Putting the two-thirds cash allocation in a short-term bond ETF like BSV allows you to recoup the 0.32% expense ratio, plus earn a little extra. Since UPRO’s inception in 2009, not including trading costs, the UPRO/BSV top-off portfolio has generated a CAGR of 15.3%, compared to SPY’s 14.3%. Going back to 1994, a 3x SPY/short-term bond portfolio has beaten SPY in 21 out of 22 years, with an average 3.1% annual outperformance. For S&P 500 investors, I see little downside to implementing a UPRO/BSV portfolio to consistently beat SPY. Background I’ve written a few articles on combining leveraged ETFs with cash or the underlying index to realize portfolios with certain properties (see for example Build Your Own Leveraged ETF ). There are a few neat things you can accomplish: Achieve any leverage between 0 and the highest multiple leveraged ETF available. Achieve a leverage multiple of an existing ETF by combining cash with a higher multiple leveraged ETF, potentially reducing your net expense ratio. Achieve net leverage of 1 by holding for example one-third of your money in a 3x leveraged ETF, and the remaining two-thirds in cash. The last point leads to the natural question: If I can mimic the SPDR S&P 500 Trust ETF ( SPY) while tying up only 33% of my available balance, why not put the remaining 67% to work in a low-risk fund that generates a few extra percentage points in growth every year? One-Third UPRO, Two-Thirds BSV The ProShares UltraPro S&P 500 ETF (NYSEARCA: UPRO ) is a leveraged ETF that aims to multiply daily S&P 500 gains by a factor of 3. It has an expense ratio of 0.95%. The Vanguard Short-Term Bond ETF (NYSEARCA: BSV ) is a short-term bond fund with an expense ratio of 0.10%. Let’s take a look at how a one-third UPRO, two-thirds BSV portfolio would have performed over these funds’ mutual lifetimes. (click to enlarge) Sure enough we get a nice little top-off with the UPRO/BSV strategy. The compound annual growth rate was 14.3% for SPY, 15.3% for UPRO/BSV rebalanced daily with no fees, and 14.8% for UPRO/BSV rebalanced whenever the effective leverage went below 0.9 or above 1.1 (with a $7 trading fee). Sharpe ratios were 0.058, 0.063, and 0.061, respectively. Of course, the greater your portfolio’s balance, the more your growth would look like the blue curve rather than the red one, since you can rebalance very frequently without trading costs hurting you very much. I know, an extra 1% isn’t that much. But just like a 1% expense ratio can really hurt you over time, a 1% boost every year can really make a big difference. If you go year by year you see that UPRO/BSV tends to tack on an extra 1-2% to SPY’s annual growth, although it doesn’t always. Annual growth of SPY and UPRO/BSV portfolios. Year SPY BSV UPRO/BSV (no fees) UPRO/BSV (fees) 2009 22.3% 2.1% 23.7% 23.4% 2010 13.1% 3.8% 15.5% 14.0% 2011 0.9% 3.0% 2.3% 2.2% 2012 14.2% 1.5% 14.9% 14.2% 2013 29.0% 0.2% 28.3% 28.1% 2014 14.6% 1.4% 14.9% 14.9% 2015 -7.1% 1.4% -6.6% -7.2% One-Third 3x Leveraged ETF, Two-Thirds VBISX We can only look at UPRO/BSV back to 2009, but it’s easy enough to switch UPRO for a hypothetical 3x SPY ETF, and switch BSV for the Vanguard Short-Term Bond Index Fund Investor Shares (MUTF: VBISX ), so we can go back further. For the 3x SPY ETF, we’ll assume no tracking error and a 0.95% annual expense ratio, mimicking UPRO. The correlation between daily gains for the simulated 3x SPY ETF and UPRO since UPRO’s inception is 0.997. The correlation between monthly gains for BSV and VBISX since BSV’s inception is 0.963. Let’s see how one-third 3x SPY, two-thirds VBISX would have performed since 1994. (click to enlarge) The top-off portfolios achieved nearly double the balance of SPY over the 20.5-year period. Sharpe ratios were 0.033 for SPY, 0.043 for 3x SPY/VBISX with no fees, and 0.043 for 3x SPY/VBISX with fees. Of course it is important to note that VBISX has done really well since 1994, with a CAGR of 4.4%. Note that the top-off portfolio with fees beat SPY in 21 out of 22 years (all except 1994), and on average beat SPY by 3.1%. You can see the consistent annual outperformance below. (click to enlarge) Another way to visualize the outperformance of the top-off portfolio relative to SPY: (click to enlarge) A Portfolio Optimization View I came to the one-third 3x SPY, two-thirds short-term bonds portfolio from the perspective of mimicking SPY by combining a 3x leveraged ETF with cash, but then putting the cash to work to gain an extra few percentage points. But you can also view the strategy from a portfolio optimization perspective. A short-term bond fund like BSV has positive alpha simply from the fact that it yields a certain small percentage annually from maturing bonds of various durations. So in periods when SPY is flat, BSV still tends to grow (i.e. it has positive alpha). Indeed if you regress monthly VBISX gains vs. monthly SPY gains going back to 1994, VBISX has alpha of 0.0036 (p < 0.001), meaning it gains on average 0.36% in months when SPY is flat. Typical Stocks/Bonds Story? It is well-known that holding both stocks and bonds tends to improve risk-adjusted returns. But if you hold an S&P 500 index fund in addition to bonds, your net beta drops below 1 and you often sacrifice raw returns. The UPRO/BSV approach is unique in that it keeps beta at 1 (assuming BSV has no correlation with SPY), while increasing both risk-adjusted and raw returns. Something like a free lunch. Upping the Ante A natural extension of the UPRO/BSV top-off strategy is combining UPRO with a longer duration bond fund. For example I like one-third UPRO, two-thirds BND, for a bigger top-off. But BND is much more variable than BSV, and also much more sensitive to rising interest rates. Another way to "up the ante" so to speak is to aim for some leverage greater than 1, say 1.25 or 1.5. You can still combine UPRO with BSV to get some extra growth at any leverage below 3, but the greater your net leverage, the greater your allocation to UPRO has to be, and the less you have left over to grow in BSV. Risks Many investors may not be comfortable with a portfolio that requires a significant allocation to a leveraged fund. Indeed, there are risks associated with leveraged funds. In particular: If SPY ever experiences an intraday loss of one-third its opening price, you could lose the entire balance in the leveraged ETF. While leveraged S&P 500 ETFs like UPRO have historically had very little tracking error, daily gains may occasionally deviate from the target multiple. In between rebalancing periods, you may suffer some irrecoverable losses due to volatility decay. It is important to note that while the top-off strategy uses leveraged ETFs, the target net leverage for the portfolio is 1. In that sense, the portfolio is not prone to the greatly amplified volatility (and potentially catastrophic drawdowns) usually associated with leveraged ETFs. It is very important to understand these issues before implementing the SPY top-off strategy. Indeed, many investors may decide that the potential for slightly higher annual returns does not justify the added risks. I personally believe that the risk/reward for the strategy is favorable. Conclusions A one-third UPRO, two-thirds BSV portfolio should behave very similarly to a 100% SPY portfolio, but often generate an extra 1-4% annual return. You'll have to monitor your effective leverage (multiply your UPRO allocation by 3) and rebalance when it deviates much from 1, but for a reasonably sized portfolio this should not detract much from your extra gains relative to SPY. Of course, you don't have to use UPRO and BSV. Other 3x S&P 500 ETFs and short-term bond funds should perform similarly. And if you want an extra boost, consider pairing the leveraged ETF with an intermediate or long-term bond fund, or a total bond fund. But your annual gains will be more variable, and you may suffer losses as interest rates rise. I am currently implementing the SPY top-off strategy with UPRO and BND, but may switch to UPRO and BSV in the near future for a more consistent, albeit smaller, bonus. Ideally, I'll beat SPY by a little bit every year, and eventually be happy.

Plan To Survive: Be Systematic!

Surviving this environment is tough. Investors need evidence-based methods (EBM). This series will provide some tools. To survive the current investment environment, investors need systematic, evidence-based methods which will skew the odds in their favor. In this series, I will present a variety of strategy indices which my firm has created, which will provide some tools to aid in survival. In a the dog-eat-dog world of the financial markets, solid technology is essential. My firm has created a variety of strategy indices which have pounded the S&P 500, utilized structural forms of alpha creation, and reduced investors’ correlation to the stock market. This year, we will focus on strategies which have a low correlation to both stocks and to bonds. As always, our cutting-edge strategies are only available to subscribers, but I hope that some of the strategy indices presented here will provide inspiration for readers to create their own methods for dealing with an increasingly difficult investment environment. Remember, hope is for people who do not use data. Wise investors plan using evidence-based methods. Please note that even though the rules of this strategy index have been publicly-released, that like any other index, we require the execution of a licensing agreement with ZOMMA LLC for any form of commercial use whatsoever. ZOMMA Quant Warthog II Rules: I. Buy UPRO (NYSEARCA: UPRO ) with 30% of the dollar value of the portfolio. II. Buy TMF (NYSEARCA: TMF ) with 20% of the dollar value of the portfolio III. Buy EUO (NYSEARCA: EUO ) with 40% of the dollar value of the portfolio. IV. Buy UGL (NYSEARCA: UGL ) with 10% of the dollar value of the portfolio. V. Rebalance annually to maintain the 30%/20%/40%/10% dollar value split between the instruments. Here are the results of a backtest of these rules in a log scale: (click to enlarge) (click to enlarge) What is the intuition behind this market-thumping performance? UPRO is a 3X leveraged S&P 500 ETF. TMF is a 3X leveraged 20+ years government bond fund ETN. EUO is a 2X short Euro ETF, and UGL is a 2X leveraged gold ETF. In a flat to bullish environment for bonds, the often inverse nature of stock / bond correlation is well known. Hence the UPRO/TMF inclusion in the index. In addition, since the leverage in the instruments in non-recourse, the use of UPRO/TMF is far safer than the use of margin leverage. Indeed, UPRO/TMF can only go to zero. However, in a rising interest rate environment, long-dated government bonds often get slammed, but the higher interest rates lead the dollar to strengthen. A 2X short Euro ETF is synthetically long the dollar. When U.S. interest rates rise, since this makes the dollar more attractive, EUO should jump with rising real U.S. interest rates. Therefore, EUO acts as a hedge for TMF. In addition, a synthetic dollar long position can be an excellent hedge in a deflationary environment in which the U.S. dollar strengthens. The UGL allocation is for a potential hyperinflation or monetary debasement scenario in which bonds and the dollar get slammed. The 2X leveraged gold ETF has the ability to help in such a scenario. Remember, UGL can jump dramatically, but because the leverage in UGL is inherent to the instrument and non-recourse, it can only go to zero. Indeed, the leveraged nature of the instruments acts like a call option on various asset classes, without the margin leverage inherent in other paradigms such as Risk Parity. This strategy index is truly impressive. It has 6 percentage points less maximum drawdown than the SPY (NYSEARCA: SPY ), while having 6 percentage points more of CAGR. In addition, it accomplishes this feat with only a 0.36 correlation to SPY. Very impressive. But what is this strategy index’s correlation to long-dated government bonds? Here are the results of a backtest of these rules in a log scale: (click to enlarge) The strategy index is only 0.36 correlated to leveraged long bonds as well. Extremely impressive. And with a Sharpe ratio of 1.51, the strategy is a serious tool in the investor’s toolbox. And this strategy index achieves low correlations to stocks and to fixed income, without strong commodity correlation either. Below is a log scale graph of the strategy index’s backtested rules compared to its UGL 2X leveraged gold component: (click to enlarge) The strategy index has only a 0.29 correlation to UGL. To summarize, the index has a low correlation to stocks, to bonds, and to commodities. Therefore, for investors who wisely fear that bear markets in stocks, in bonds, or in commodities could hurt their portfolios, perhaps they should consider an index which offers the chance of a low correlation to all three asset classes. Remember, hope is for people who do not use data. Wise investors plan using evidence-based methods. Solid evidence-based technology goes a long way. At the very least, this index is a valuable tool for conceptualizing issues of correlation and diversification within an evidence-based framework. Thanks for reading. Hypothetical performance results have many inherent limitations, some of which are described below. No representation is being made that any account will or is likely to achieve profits or losses similar to those shown; in fact, there are frequently sharp differences between hypothetical performance results and the actual results subsequently achieved by any particular trading program. One of the limitations of hypothetical performance results is that they are generally prepared with the benefit of hindsight. In addition, hypothetical trading does not involve financial risk, and no hypothetical trading record can completely account for the impact of financial risk of actual trading. For example, the ability to withstand losses or to adhere to a particular trading program in spite of trading losses are material points which can also adversely affect actual trading results. There are numerous other factors related to the markets in general or to the implementation of any specific trading program which cannot be fully accounted for in the preparation of hypothetical performance results and all which can adversely affect trading results. Disclosure: I/we have no positions in any stocks mentioned, but may initiate a long position in SPXL, TMF, EUO, UGL over the next 72 hours. (More…) I wrote this article myself, and it expresses my own opinions. I am not receiving compensation for it (other than from Seeking Alpha). I have no business relationship with any company whose stock is mentioned in this article.

How To Design A Market Neutral Portfolio – Part 3

Summary How to build a robust long side. Which ETF on the short side. How to make it IRA-compliant. The first article of the series described the investor profile to hold a market neutral portfolio, some characteristics of this investing style. The second one explained the benefit of sector diversification, with examples. This one simulates solutions for the hedging position with various ETFs: leveraged and non leveraged, inverse and regular. People implementing an equity market neutral strategy usually have two balanced sets of individual stocks on both sides (long and short). Before going to the point, I want to come back on the reason why I prefer a single index ETF position on the short side. My opinion is that ‘Market Neutral’ is for risk-averse investors. Therefore it is also better to avoid a potentially unlimited risk that is not related to the market: being trapped in a short squeeze. People who think that this risk is limited to penny stocks and small caps have a short memory, or don’t know some cases. My preferred example is the ‘mother of all short squeezes’ that happened in 2008 when Volkswagen AG became briefly the highest capitalization in the world after its share price was multiplied by five in 2 days. Then it fell back to its initial level even more quickly. In the interval, investors and traders on the short side covered their positions at any price with huge losses, in panic or forced by their brokers. Whatever the reason (in this case a corner engineered by a major shareholder), and the consequences (at least a suicide has been attributed to that), I prefer avoiding by design this kind of event. Even absorbed in a diversified portfolio, such a shock hurts and may trigger a margin call for leveraged investors. On the long side… The quantitative models used for the long side of my real market neutral portfolio will not be disclosed here. However, I want to share some of its characteristics that may be reused by readers in another context. The portfolio is based on 5 different models: 2 with defensive stocks, 2 with cyclical stocks, 1 based on growth and valuation with no sector limitation. All models are based on rankings using fundamental factors. 24 stocks are selected: 14 in the S&P 500 index, 5 in the Russell 1000 index, 5 in the Russell 3000 index. The number of stocks has been chosen to limit the idiosyncratic risk. The sector diversification pattern should help beat the hedge in most phases of the market cycle. The diversification in rankings across models should limit the risk of over-optimization. The focus on large capitalizations is a choice of comfort (for myself) and ethic (for subscribers). Russell 3000 stocks are filtered on their average dollar daily volume. The portfolio is rebalanced weekly, but backtests show that a bi-weekly rebalancing doesn’t hurt the long-term performance. However, the hedge should always be rebalanced weekly. The next chart shows the simulation of this 24-stock portfolio (long side only) since 1999, with a 0.3% transaction cost and a 2-week rebalancing: (click to enlarge) Past performance, real or simulated, is never a guarantee of future returns. However, for a diversified portfolio like this one, it gives some clues about the robustness. Especially when robustness has been integrated from the design process, not just as the result of backtest optimization. On the short side… Some readers will be scared if I tell them abruptly that I use a leveraged 3x inverse ETF. Most people who are afraid of leveraged ETFs don’t really understand where their ‘decay’ comes from. If you exclude the management fee (under 1% a year), the decay has two names: roll-over cost and beta-slippage. The holdings of leveraged S&P 500 ETFs (inverse and regular) are swaps for the biggest part, and futures in second position. Rollover costs are close to zero for such contracts on the S&P 500. For beta slippage, some of my old articles have already explained what it is , and why I don’t fear it on S&P 500 leveraged ETFs. In short: most leveraged ETFs are harmful as long term holdings, but not all of them. The next table is a summary of backtests for the portfolio with different hedges, period 1/1/1999 to 11/29/2014 (weekly rebalancing). The ETF used are the ProShares Short S&P 500 ETF ( SH), the ProShares UltraShort S&P 500 ETF ( SDS), the ProShares UltraPro Short S&P 500 ETF ( SPXU) and the ProShares UltraPro S&P 500 ETF ( UPRO). For most cases it shows the performance without leverage, and with a leverage factor corresponding to holding the stocks on capital and the hedge on margin. Price data are synthetic before the inception dates (calculated by data provider). Hedge Leverage An.Ret. (%) DD (%) DL (weeks) K (%) No no 28 36 103 24 SH no 10 10 54 25 SH 2 23 23 54 25 SDS no 14 12 54 28 SDS 1.5 21 17 54 28 SPXU no 15 9 54 30 SPXU 1.33 21 11 54 30 UPRO (short) no 16 8 51 33 UPRO (short) 1.33 22 10 51 33 SPXU 50% no 20 17 51 34 SPXU 50% 1.167 24 19 51 34 SPXU 75% no 17 11 49 33 SPXU 75% 1.25 23 14 50 33 SPXU Timed no 25 15 50 34 SPXU HalfTimed no 20 10 48 36 SPXU HalfTimed 1.33 28 13 49 36 An.Ret.: annualized return DD: max drawdown depth on rebalancing (it may be deeper intra-week) DL: max drawdown length K: Kelly criterion of the weekly game, an indicator of probabilistic robustness The ‘Timed’ version uses a signal based on the 3-month momentum of the aggregate S&P 500 EPS and the U.S. unemployment rate. ‘Half Timed’ means that 50% of the hedging position is permanent, the other 50% is timed. Among the 100% market neutral versions, shorting UPRO looks better at first sight… but it is not after taking into account the borrowing rate (4.48% last time I had a look at UPRO properties in InteractiveBrokers platform). As it represents 25% of the total portfolio, the drag on the portfolio annual return is about 1%, which gives the same performance as with SPXU. I prefer buying SPXU and eliminating the inherent risk of short selling. Moreover, U.S. tax-payers can implement this kind of strategy in an IRA account if they use SPXU. Such a portfolio can be traded without leverage, but cash and IRA accounts usually have a 3-day settlement period. It is recommended trading at a broker offering a limited margin IRA feature waiving the settlement period and the risk of free-riding. It seems that Interactive Brokers and TD Ameritrade do that (and maybe others). Inform yourself carefully. Data and charts: Portfolio123 Additional disclosure: Long SPXU as a hedge.