Tag Archives: nysearcaung

The Weakness In The Natural Gas Market Persists

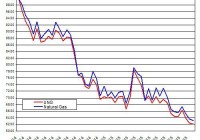
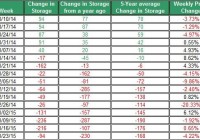
Summary The price of UNG kept coming down last week. The low extraction from storage is related to the warmer-than-normal weather. The recent rally in oil didn’t bring UNG back up. The recent recovery in the oil market didn’t provide any back-wind for The United States Natural Gas ETF, LP (NYSEARCA: UNG ) that kept coming down in the past week. The Energy Information Administration reported another lower-than-anticipated withdrawal from storage. (Data Source: EIA, Google Finance) The chart above presents the normalized prices of natural gas and UNG since the end of November 2014 till date – over this time frame, UNG fell by 38% and natural gas by almost 37%. This modest gap is due to roll decay attributed to the contango in futures markets. For now, the markets are still in contango, which means this gap between UNG and natural gas prices is likely to further widen in the coming months. But this also suggests that the market expects natural gas prices to start picking up again in the coming months. The EIA reported another lower-than-expected extraction from storage of 115 Bcf. In comparison, the extraction last year was 270 Bcf and the 5-year average was 165 Bcf (as a side note: these comparisons are only intended to provide crude base lines – after all, they also entail a lot of noise (as is the case in any weekly comparison), and as such, we should put an asterisk next to these base lines). The ongoing lower-than-expected extraction from storage may have rendered another blow to UNG this week. Most of the shifts in storage this time of the year are related to changes in weather. The relation between the changes in storage compared to the 5-year average and the shifts in temperatures from normal has remained strong this winter – the linear correlation is still at 0.74, which means the R-square is around 54% (this result in based on certain assumptions, including linearity and normality – two assumptions that might not hold up under scrutiny). This result only tends to show that the ongoing warmer-than-normal winter, on a national level, has kept the extraction from storage lower than normal for this extraction season. On top of this, the current storage level is around 24% higher than only 1.2% below the 5-year average. So the lower extraction, along with relatively normal storage levels has been enough to bring down the price of UNG to its current low levels. (Data Source: EIA , National Climate Data Center ) Last week’s deviation from normal temperatures was 6.38. So for next week’s storage report, the extraction from storage is likely to be, yet again, lower than the 5-year average, which was 165 Bcf. The ongoing low withdrawal is likely to bring storage to even slightly higher-than-normal levels in the coming weeks. Over the next couple of weeks, the weather is still projected to be colder than normal in the east and hotter than normal in the west. For February, the recent monthly report of the National Oceanic and Atmospheric Administration predicts above-normal temperatures in many parts of the U.S., except for certain regions such as the Northeast. But the weather forecast still entails uncertainty mainly related to a potential El Nino. But for now, it seems hard to see how UNG will start to pick up again to its high levels unless the weather starts to get much colder than it is now. After all, even the recent recovery in oil prices didn’t bring natural gas up. The recent news from Baker Hughes of the sharp drop in oil rigs has influenced oil inventors to adjust (or speculate on) their expectations about changes to the U.S. oil supply. This news brought oil prices back up in the past week. Oil rigs have declined by 83 rigs last week, and by a total of 276 rigs in the past year. But this rally didn’t seem to have much of an impact on natural gas prices, which only kept coming down. After all, gas rigs slipped by only 5 in the past week to reach 314. The uncertainty in the weather forecast for February could imply high volatility in the natural gas market. If the withdrawal from storage continues to be lower than normal, this could keep the price of UNG down. For more see: ” Has the Weakness in Oil Fueled the Decline of UNG? ” Disclosure: The author has no positions in any stocks mentioned, and no plans to initiate any positions within the next 72 hours. (More…) The author wrote this article themselves, and it expresses their own opinions. The author is not receiving compensation for it (other than from Seeking Alpha). The author has no business relationship with any company whose stock is mentioned in this article.

Cold Weather Isn’t Enough To Turn UNG Around

Colder-than-normal weather in parts of the U.S. wasn’t enough to bring back up UNG. This week’s extraction from storage was lower than the 5-year average. EIA still estimates this year’s natural gas demand in the residential and commercial sectors will decline. Next week’s EIA report is expected to show another lower-than-normal extraction from storage. The lower-than-normal extraction from storage and ongoing weakness in the oil market have contributed to the decline of The United States Natural Gas ETF (NYSEARCA: UNG ) to fall below $14 – its lowest price this year. Let’s examine the latest from the natural gas market. The cold weather, mainly in the Northeast, wasn’t enough to keep the price of UNG up as it fell by over 8% during the past week. In the past two months, UNG shed nearly 35% off of its value. This week’s withdrawal from storage was only 94 Bcf – this is below the 5-year average withdrawal, which was 168 Bcf. This comes after two consecutive weeks of above-normal withdrawals from storages. Source of data taken from EIA In next week’s EIA storage update, the extraction from storage could be again lower than the 5-year average – which is 165 Bcf for the last week of January. This is because last week’s deviation from normal temperatures was, on average, 5.93. The correlation between the deviation from normal temperatures and extractions from storage is high at 0.61. Thus, the higher-than-normal temperatures, on a national level, could tilt the scales towards a lower-than-normal withdrawal. Source of data taken from EIA If we were to assume the extraction from storage to remain, on average, 15% higher than the 5-year average, then the storage is likely to be slightly above the 5-year average by the time the extraction season ends in April. Source of data taken from EIA Despite the lower-than-normal extraction from storage, the weather is still expected to be colder than normal throughout the east coast, including in the Northeast over the next two weeks. Conversely, throughout the west coast, temperatures are still projected to remain above normal temperatures. Nonetheless, the uncertainty in the weather is still expected to be high during February, according to latest National Oceanic and Atmospheric Administration monthly report. So we could still see big swings in the price of UNG in the coming weeks. For now, the EIA still predicts that this year’s natural gas consumption in the residential/commercial sectors will decline in 2015. This could be due, in part, to lower demand for heating purposes during this year’s winter. Nonetheless, total consumption is projected to reach 73.8 Bcf per day this year – this is a 0.3% gain compared to the average consumption in 2014. The rise in demand is expected to come from industrial and electric power sectors. In the power sector, coal is being pushed out for natural gas. But it’s still used by major utility companies. Bear in mind, that if coal prices were to keep coming down, as they did in recent weeks, this could also play a secondary role in driving down prices of natural gas. Finally, the weakness in the oil market may have also contributed to the weakness of natural gas. In recent weeks, the linear correlation between oil and natural gas strengthened and reached 0.54 (this is for the past month) – this is a strong and positive correlation albeit this relation doesn’t hold up over extended periods of the time. This is yet another issue to keep in mind. After all, Goldman Sachs lowered its outlook for its U.S. natural gas for this year. This was due to deflationary pressure on prices – the pressure comes from low oil prices that are likely to cut down drilling and services costs, and thus reduce the cost per barrel for shale gas. In other words, Goldman Sachs thinks that drilling companies will drill where it makes fiscal sense to do so considering the current low oil prices; this will also result in lower cost of drilling for natural gas. The recent fall in UNG may have stemmed from the weaker-than-expected demand for natural gas, ongoing strong production and low oil prices. The uncertainty in the weather could still bring back up UNG for a short term. But for now, UNG is still expected to remain low for the season. For more see: A Couple of Notes on Oil

iPath Natural Gas ETN Is A Broken Product

ETF and ETN investors should avoid broken products. I have repeated this caution numerous times over the years. Upon hearing this warning, most investors want to know what a broken product is. Once they understand the definition, they quickly grasp the danger. ETFs and ETNs are unique securities. The primary feature that differentiates them from other investment vehicles is the ability to create and redeem shares, typically through an in-kind exchange process. Another key feature is the publishing of the underlying portfolio’s value throughout the trading day. The two features combined allow market makers to keep the trading price very close to the value (often called the Intraday Value or the iNAV). This is the “promise” behind ETFs and ETNs, and investors expect these products to live up to it. However, sometimes the share creation mechanism is suspended or terminated for a given product, and that is when it becomes a broken product. Without a viable share creation process, an ETF or ETN can trade like a closed-end fund with price premiums. The typical retail investor does not have an easy way of knowing if a product is broken or not, and that is where the danger lies. It could be trading at a substantial premium, a premium that could disappear instantly. This is not just a theoretical problem; it is very real and happening today. You are probably aware that crude oil prices have been falling for a number of months. More recently, natural gas prices plunged. ETFs and ETNs tracking natural gas fell right along with the underlying commodity. Last week, the United States Natural Gas Fund (NYSEARCA: UNG ) dropped 12.5%. The leveraged ProShares Ultra Bloomberg Natural Gas ETF (NYSEARCA: BOIL ) was whacked for a 22.6% loss. However, the iPath DJ-UBS Natural Gas Total Return Sub-Index ETN (NYSEARCA: GAZ ), an unleveraged product tracking the same index as BOIL, gained 5.9%. The reason for this is because GAZ is a broken product. On August 21, 2009, Barclays “temporarily suspended” the creation unit process for GAZ . More than five years later it is still suspended, straining the credibility of the word temporarily. I’m willing to bet most investors are unaware GAZ is broken. Without the ability to create and redeem units of GAZ, it is impossible for market makers to keep the trading price near the net asset value (“NAV”). The NAV of GAZ went from $1.9182 to $1.5874 per unit last week, a plunge of 17.2%. The price went the other way, increasing from $2.02 to $2.14. GAZ started the week trading at a 5.3% premium and closed with a 34.8% premium. The premium narrowed slightly earlier this week, but it was more than 36% at the close on Wednesday. Anyone buying GAZ today is far more than it is worth. This is not a traditional liquidity problem, as GAZ has averaged more than 100,000 shares a day recently. This high volume suggests that many participants are unaware of its broken product status. One day, regulators may require investors be informed they are buying a broken product by requiring a ticker symbol suffix or some other means. Until then, be careful out there, and don’t get caught owning a broken product when the premium disappears . Disclosure covering writer, editor, and publisher: No positions in any of the securities mentioned. No positions in any of the companies or ETF sponsors mentioned. No income, revenue, or other compensation (either directly or indirectly) received from, or on behalf of, any of the companies or ETF sponsors mentioned.