UGAZ Capitulates On ‘The Bloodbath’ – It’s Time To Get Long
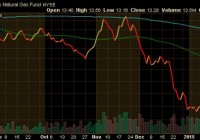
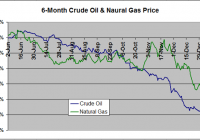
Summary UGAZ, as expected, capitulated into “The Bloodbath” that was inventory on another miss. UGAZ held $2.50 strong and I believe is a nice round number that energy desks will build positions around. BUY UGAZ or DCA into a lower cost basis if you’re already long – “The Turn” has happened. With the EIA Natural Gas Inventory report coming in at -115 BCF against expectations of -121 BCF and the subsequent drop in natural gas pricing, which is most popularly played using The United States Natural Gas ETF, LP (NYSEARCA: UNG ), I believe post- Blood Bath the bottom for natural gas is in. I’ll explain further. (click to enlarge) After outlining the longer term natural gas bull thesis (click “Blood Bath” above) I believe “The Turn” for natural gas pricing has happened. Now, what does that mean? I can’t possibly outline my positions in real time to readers outside of guiding that I own VelocityShares 3x Long Natural Gas ETN (NYSEARCA: UGAZ ) at $2.90 and will add to my position tomorrow in the early AM to average down my cost basis. Over the next 9 months I’ll be offloading and adding to my net natural gas exposure, inclusive of selling and buying UGAZ and inclusive of selling and buying hedges via UNG options, in an effort to maximize the longer term bullish trend. I’ve ridden trends using this strategy the last two years with great success both on the long and short side. (click to enlarge) So, I’ll outline my thoughts on immediate term, mid-term, and longer term trends with following recommendations – this will become a regular section of these weekly updates, make sure to # FOLLOW me and subscribe to real time alerts for the UGAZ ticker: Immediate Term (next 7 days): bullish, BUY. This is going to be against consensus as weather is expected to be in the mid-70’s for HOD’s for the middle part of the country with LOD’s coming in at just over 50 degrees. Normally, this would be bearish and it just might be during the next 7 days leading into inventory. IF UGAZ is hit – BUY (see Long Term bullet) as we are at what should be generational lows. I’m going against consensus in estimating that UGAZ is higher than its most recent close of $2.48 but 1) I just can’t imagine cooling demand not upticking in the middle part of the country (namely Texas) as this will be the first time in a long time that folks have felt anything resembling heat, I’m betting folks overreact in that it will “feel” hotter than it is and that cooling demand comes on strong and 2) I can’t imagine big energy desks not beginning to build longer term positions right here, that should provide some volume on any drops to pricing. Mid Term (next 30 days): Mixed to flat as of right now, BUY in the immediate term and wait on further buys. Guys, I had watch the inventory report post greater than 90 BCF reports 8 consecutive weeks in the middle of summer (including builds of 91BCF, 87BCF, 94BCF, 105BCF, 112BCF, 97BCF, 90BCF, 92BCF), the middle of what was supposed to be the bull thesis, before the market gave me some credit and ran natural gas pricing down. I was looking VERY foolish for about two months as the price of natural gas was denying all fundamentals. Eventually, everything has to be priced efficiently and thank goodness I had conviction in my short position. That said, I’m never willing to say that my thesis will play out exactly on time or exactly in lock step with developments. Wait on further buys in the mid-term once you get some position on the board at these lows. Long Term (longer than 30 days): bullish, BUY on dips as far as $2.00. I have no question natural gas is higher than its current close in 30 days. If you plan on buying for the long term and not trading around you should build positions on dips down to $2.00. No questions natural gas is at the lows. We’ll see over the next few weeks how many institutional holders have to be wrong (by selling or shorting natural gas) but just like always eventually they’ll come around. If you’re in this name for a once a month buy/sell the decision to buy is easy. Just do it. I understand I can post one update article per regular long article so if a major weather change develops or something else comes along that would change my immediate term opinion I’ll post an update article. Check back daily to make sure no updates have been posted. Remember, mid-term and longer-term reco’s aren’t effected by week to week developments. Also remember, the current bull thesis is as follows: Falling rig counts hurt overall production – that’s good for the supply side of the equation as production is slowed overall. Less oil E&P to come on lower CAPEX across the board for oil and natural gas E&Ps – that’s also good for the supply side of the equation (Source: Bloomberg.com). I’m betting on the fact that spring will start early and summer will be, well, it’ll be hot – that’s good for the demand side of the equation – for clarity these projections are based on longer term weather models from Weather.com which may be unreliable. I believe at poor hedging or at lower than ideal aggregate hedging that natural gas E&P names won’t “pump baby pump” as hard into what has been excellent hedging in size the last few years – that’s also good for the supply side. Examples of companies I’ve reviewed that have 1) less than ideal pricing hedging or 2) less than ideal aggregate hedging coverage are Chesapeake Energy Corporation (NYSE: CHK ), Antero Resources Corporation (NYSE: AR ), Ultra Petroleum Corp. (NYSE: UPL ), Halcon Resources Corporation (NYSE: HK ), SandRidge Energy, Inc. (NYSE: SD ), Quicksilver Resources Inc. (NYSE: KWK ), etc. This list could have been 50 names deep. Finally, please read the disclosure section of this article as playing leveraged commodity ETN’s is dangerous and requires a constant monitoring of positions. Good luck everybody, I’ll see you next week in The Lounge. Disclosure The risks of investing in a 3X leveraged commodity trading vehicle like UGAZ/DGAZ are much greater than those of other vehicles. These risks include (Source: Velocitysharesetns.com/ugaz): ETNs are only suitable for knowledgeable investors seeking daily exposure (including inverse or leveraged exposure) to the underlying index. ETNs are intended for short-term trading, therefore investors with a horizon longer than one day trading should carefully consider whether the ETNs are appropriate for their investment portfolio. Because the inverse leveraged ETNs and leveraged long ETNs are linked to the daily performance of the applicable underlying Index and include either inverse and/or leveraged exposure, changes in the market price of the underlying futures will have a greater likelihood of causing such ETNs to be worth zero than if such ETNs were not linked to the inverse or leveraged return of the applicable underlying Index. The ETNs do not guarantee any return of principal at maturity and do not pay any interest during their term. At higher levels of volatility, and since the ETNs are not principal protected, there is a significant chance of a complete loss of ETN value even if the performance of the index is flat. The closing indicative value on each valuation date is determined in part by reference to the daily percentage change in the level of the underlying index. As a result, to the extent the closing indicative value of the ETNs is greater than or less than the initial indicative value, subsequent changes in the level of the index may have a bigger or smaller impact on the closing indicative value of the ETNs than if the closing indicative value remained constant at the initial indicative value. For example, assuming an initial indicative value of $100, if the closing indicative value of the ETNs increases above $100, a subsequent 1% daily change in the level of the index will result in more than a $1 decrease in the closing indicative value of the ETNs. Likewise, if the closing indicative value of the ETNs is less than $100, a 1% increase in the level of the index will result in less than a $1 increase in the closing indicative value of the ETNs. If the level of the underlying index decreases or does not increase sufficiently (or if it increases or does not decrease sufficiently in the case of the inverse ETNs), to offset the effect of the Daily Investor Fee over the term of the ETNs, the investor will receive less than the principal amount of his investment upon early redemption, acceleration or maturity of the Notes. This particular ETN also runs the risk of being decayed by contango which is defined by Investopedia as: A situation where the future price of a commodity is above the expected future spot price. Contango refers to a situation where the future spot price is below the current price, and people are willing to pay more for a commodity at some point in the future than the actual expected price of the commodity. This may be due to people’s desire to pay a premium to have the commodity in the future rather than paying the costs of storage and carry costs of buying the commodity today. Finally, there are general risks that should also be considered such as liquidity risk (Source: Investopedia.com): The risk stemming from the lack of marketability of an investment that cannot be bought or sold quickly enough to prevent or minimize a loss. Liquidity risk is typically reflected in unusually wide bid-ask spreads or large price movements (especially to the downside – which are magnified in leveraged ETNs) . The rule of thumb is that the smaller the size of the security or its issuer, the larger the liquidity risk. Disclosure: The author is long UGAZ. (More…) The author wrote this article themselves, and it expresses their own opinions. The author is not receiving compensation for it (other than from Seeking Alpha). The author has no business relationship with any company whose stock is mentioned in this article. Additional disclosure: The author is long UGAZ at equal sizes at $2.90 and $2.48. The author has a cost basis of $2.69

