Plan To Survive: Be Systematic!
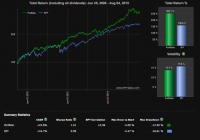
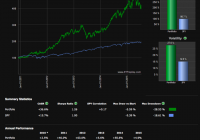
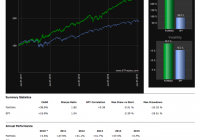
Surviving this environment is tough. Investors need evidence-based methods (EBM). This series will provide some tools. To survive the current investment environment, investors need systematic, evidence-based methods which will skew the odds in their favor. In this series, I will present a variety of strategy indices which my firm has created, which will provide some tools to aid in survival. In a the dog-eat-dog world of the financial markets, solid technology is essential. My firm has created a variety of strategy indices which have pounded the S&P 500, utilized structural forms of alpha creation, and reduced investors’ correlation to the stock market. This year, we will focus on strategies which have a low correlation to both stocks and to bonds. As always, our cutting-edge strategies are only available to subscribers, but I hope that some of the strategy indices presented here will provide inspiration for readers to create their own methods for dealing with an increasingly difficult investment environment. Remember, hope is for people who do not use data. Wise investors plan using evidence-based methods. Please note that even though the rules of this strategy index have been publicly-released, that like any other index, we require the execution of a licensing agreement with ZOMMA LLC for any form of commercial use whatsoever. ZOMMA Quant Warthog II Rules: I. Buy UPRO (NYSEARCA: UPRO ) with 30% of the dollar value of the portfolio. II. Buy TMF (NYSEARCA: TMF ) with 20% of the dollar value of the portfolio III. Buy EUO (NYSEARCA: EUO ) with 40% of the dollar value of the portfolio. IV. Buy UGL (NYSEARCA: UGL ) with 10% of the dollar value of the portfolio. V. Rebalance annually to maintain the 30%/20%/40%/10% dollar value split between the instruments. Here are the results of a backtest of these rules in a log scale: (click to enlarge) (click to enlarge) What is the intuition behind this market-thumping performance? UPRO is a 3X leveraged S&P 500 ETF. TMF is a 3X leveraged 20+ years government bond fund ETN. EUO is a 2X short Euro ETF, and UGL is a 2X leveraged gold ETF. In a flat to bullish environment for bonds, the often inverse nature of stock / bond correlation is well known. Hence the UPRO/TMF inclusion in the index. In addition, since the leverage in the instruments in non-recourse, the use of UPRO/TMF is far safer than the use of margin leverage. Indeed, UPRO/TMF can only go to zero. However, in a rising interest rate environment, long-dated government bonds often get slammed, but the higher interest rates lead the dollar to strengthen. A 2X short Euro ETF is synthetically long the dollar. When U.S. interest rates rise, since this makes the dollar more attractive, EUO should jump with rising real U.S. interest rates. Therefore, EUO acts as a hedge for TMF. In addition, a synthetic dollar long position can be an excellent hedge in a deflationary environment in which the U.S. dollar strengthens. The UGL allocation is for a potential hyperinflation or monetary debasement scenario in which bonds and the dollar get slammed. The 2X leveraged gold ETF has the ability to help in such a scenario. Remember, UGL can jump dramatically, but because the leverage in UGL is inherent to the instrument and non-recourse, it can only go to zero. Indeed, the leveraged nature of the instruments acts like a call option on various asset classes, without the margin leverage inherent in other paradigms such as Risk Parity. This strategy index is truly impressive. It has 6 percentage points less maximum drawdown than the SPY (NYSEARCA: SPY ), while having 6 percentage points more of CAGR. In addition, it accomplishes this feat with only a 0.36 correlation to SPY. Very impressive. But what is this strategy index’s correlation to long-dated government bonds? Here are the results of a backtest of these rules in a log scale: (click to enlarge) The strategy index is only 0.36 correlated to leveraged long bonds as well. Extremely impressive. And with a Sharpe ratio of 1.51, the strategy is a serious tool in the investor’s toolbox. And this strategy index achieves low correlations to stocks and to fixed income, without strong commodity correlation either. Below is a log scale graph of the strategy index’s backtested rules compared to its UGL 2X leveraged gold component: (click to enlarge) The strategy index has only a 0.29 correlation to UGL. To summarize, the index has a low correlation to stocks, to bonds, and to commodities. Therefore, for investors who wisely fear that bear markets in stocks, in bonds, or in commodities could hurt their portfolios, perhaps they should consider an index which offers the chance of a low correlation to all three asset classes. Remember, hope is for people who do not use data. Wise investors plan using evidence-based methods. Solid evidence-based technology goes a long way. At the very least, this index is a valuable tool for conceptualizing issues of correlation and diversification within an evidence-based framework. Thanks for reading. Hypothetical performance results have many inherent limitations, some of which are described below. No representation is being made that any account will or is likely to achieve profits or losses similar to those shown; in fact, there are frequently sharp differences between hypothetical performance results and the actual results subsequently achieved by any particular trading program. One of the limitations of hypothetical performance results is that they are generally prepared with the benefit of hindsight. In addition, hypothetical trading does not involve financial risk, and no hypothetical trading record can completely account for the impact of financial risk of actual trading. For example, the ability to withstand losses or to adhere to a particular trading program in spite of trading losses are material points which can also adversely affect actual trading results. There are numerous other factors related to the markets in general or to the implementation of any specific trading program which cannot be fully accounted for in the preparation of hypothetical performance results and all which can adversely affect trading results. Disclosure: I/we have no positions in any stocks mentioned, but may initiate a long position in SPXL, TMF, EUO, UGL over the next 72 hours. (More…) I wrote this article myself, and it expresses my own opinions. I am not receiving compensation for it (other than from Seeking Alpha). I have no business relationship with any company whose stock is mentioned in this article.