Tag Archives: nysearcatlt

State Of Disunion: Safer Haven Investments Diverge From Stocks

The appetite for risk has been changing before our eyes. Large-cap U.S. stocks in the S&P 500 still rocketed mightily. Safer haven assets were every bit as desirable as the Dow and the S&P 500 in 2014. Is that uncommon for a late-stage bull market? Not particularly. On the other hand, the landscape may be changing. The S&P 500 soared 29.6% and 11.4% in 2013 and 2014 respectively, pushing the broad market benchmark to unimaginable heights. Net inflows into U.S. stock funds, including ETFs, also set records. Unfortunately, that is not always a positive sign for the asset class. The increased participation by the world’s investors in U.S. stocks may not be inordinately alarming. What might be far more ominous? The remarkable performance of safer haven assets over “stuck-in-place” stock assets since the Federal Reserve ended its third round of quantitative easing (QE3) on October 31. Specifically, the 30-year treasury yield has plummeted from roughly 3.0% to 2.4%, sending a proxy like the PIMCO 25+ Year Zero Coupon U.S. Treasury Index ETF (NYSEARCA: ZROZ ) up more than 20%. Similarly, the iShares 20+ Year Treasury Bond ETF (NYSEARCA: TLT ) has pocketed nearly 14%, while the SPDR Gold Trust ETF (NYSEARCA: GLD ) has rallied about 10%. The appetite for risk has been changing before our eyes. Remember the success of riskier equities in 2013, as investors ran from treasury bonds and gold? Indeed, 2013 was only one of two negative years for total bond returns across two decades. Equally staggering, gold appeared to many as if it might collapse altogether. The nature of risk shifted in 2014. Large-cap U.S. stocks in the S&P 500 still rocketed mightily. Yet the clear preference of stocks over safer holdings evaporated; treasuries rallied throughout the year, in spite of the near-unanimous sentiment that interest rates would fall. (Note: I am not opposed to tooting my own horn on this one – I recommended pairing large-cap stock ETFs with long duration treasury ETFs like the Vanguard Extended Duration Treasury ETF (NYSEARCA: EDV ) and ZROZ 13 months earlier.) Safer haven assets were every bit as desirable as the Dow and the S&P 500 in 2014. Some of them like TLT and ZROZ were more desirable. At least for a calendar round-trip, the ownership of historically divergent asset classes produced harmony and indivisibility. Is that uncommon for a late-stage bull market? Not particularly. On the other hand, the landscape may be changing. The perceived need for safety has risen appreciably since the Federal Reserve ended its electronic money printing in October. For example, in 2015, each of the 10 components of the FTSE Custom Multi-Asset Stock Hedge Index has gained ground, whereas the S&P 500 has drifted lower. Those component assets include long-maturity treasuries, zero-coupon bonds, munis, inflation-protected securities, German bunds, Japanese government bonds, gold, the Swiss franc, the yen and the dollar. Granted, the European Central Bank (ECB) intention to create $50 billion euros monthly for a year could reward risk-taking in the same manner that the Federal Reserve’s $85 billion per month had. On the flip side, the $600 billion euro figure that is floating on newswires may come off as underwhelming, as the Fed’s QE3 had been open-ended upon its announcement. Moreover, the “stimulus” amount ran beyond the trillion-and-a-half level. Keep in mind, you do not need to run from stock risk if you have a plan to minimize the severe capital depreciation associated with bear markets. My approach in latter stage bull markets involves pairing lower volatility stock ETFs like the iShares MSCI USA Minimum Volatility ETF (NYSEARCA: USMV ) and the iShares S&P 100 ETF (NYSEARCA: OEF ) with safer haven ETFs like the Vanguard Long-Term Bond ETF (NYSEARCA: BLV ) and EDV. If popular stock benchmarks breach 200-day trendlines, I reduce equity exposure and/or employ multi-asset stock hedging by investing in those assets with a history of performing well in moderate-to-severe stock downturns. Click here for Gary’s latest podcast. Disclosure: Gary Gordon, MS, CFP is the president of Pacific Park Financial, Inc., a Registered Investment Adviser with the SEC. Gary Gordon, Pacific Park Financial, Inc, and/or its clients may hold positions in the ETFs, mutual funds, and/or any investment asset mentioned above. The commentary does not constitute individualized investment advice. The opinions offered herein are not personalized recommendations to buy, sell or hold securities. At times, issuers of exchange-traded products compensate Pacific Park Financial, Inc. or its subsidiaries for advertising at the ETF Expert web site. ETF Expert content is created independently of any advertising relationships.
SPY-TLT Universal Investment Strategy 20 Year Backtest

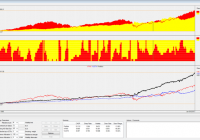
20 year strategy backtest using Vanguard VFINX/VUSTX index funds as a proxy for SPY/TLT. The strategy uses an adaptive SPY/TLT allocation, depending of the market environment. The strategy achieves 2x the return to risk ratio and a 5x smaller max drawdown than a buy and hold S&P 500 investment. In a previous article ” The SPY-TLT Universal Investment Strategy ” I presented a simple strategy which allowed to obtain an excellent return to risk ratio only by investing in variable allocations to the SPDR S&P 500 Trust ETF ( SPY) and the i Shares 20+ Year Treasury Bond ETF (NYSEARCA: TLT ) allocations. The allocation of the SPY/TLT pair is rebalanced monthly using a modified sharpe formula. For the new month, the strategy always uses the allocation ratio which achieved the highest modified sharpe ratio for a given lookback period. Here the algorithm uses a 72 day lookback period and a volatility factor of 2.5 in the modified sharpe formula: sharpe=72 day return/72 day standard deviation ^ 2.5. Several readers asked me now to present a longer backtest of this strategy. Using the Vanguard Five Hundred Index Fund Inv ( VFINX) and the Vanguard Long Term Treasury Fund Inv (MUTF: VUSTX ) as a proxy to the SPY/TLT ETFs, here is now a 20 year backtest for the UIS strategy. These index funds are only used to do the 20 year backtest. To run the strategy you would still invest using SPY and TLT. You can also use futures (ES/UB) or leveraged ETFs ( Direxion Daily S&P 500 Bull 3X Shares ETF ( SPXL)/ Direxion Daily 30-Year Treasury Bull 3x Shares ETF ( TMF) or Direxion Daily S&P 500 Bear 3X Shares ETF ( SPXS)/ Direxion Daily 30-Year Treasury Bear 3x Shares ETF ( TMV)) instead. This is explained in detail in my previous article. With these two Vanguard funds, this is now one of the rare strategies which can be easily backtested for such a long period. In general however, I think that it is much more important, how a strategy performed after 2008. The market has changed considerably during these last years, and if you would only invest in strategies which can be backtested 20 or more years, then you would have missed most of the investment opportunities of the recent years. For the backtest, I use our QuantTrader software. This software is written in C# and allows to backtest and optimize investment strategies using this sharp maximizing approach. You see the screenshot of the results below. The upper chart shows the VFINX/VUSTX performance. The middle chart shows the allocation with red=treasury and yellow=S&P500. If you look at this allocation, then you see that the market is in fact oscillating between “risk on” bull stock markets and “risk off” bear stock markets (= bull treasury market). Overall, you can say that for buy and hold investors, treasuries have been the better investment for the last 20 years. The sharpe ratio (return to risk) of the VUSTX treasury is 0.79, while the sharpe of the VFINX S&P500 fund is only 0.5. With VFINX/VUSTX combined, the strategy achieves a sharpe of 1.28, which is more than double the return to risk ratio of a stock market investment. This means, that instead of investing 100’000$ in the U.S. stock market, using leverage, you could invest 250’000$ in the UIS strategy. This way you would have the same risk, but you would get 20%-30% annual return. The strategy shows a very smooth equity line and the real max drawdown is well below 10%. The 11.68% drawdown peak measured in 2008 was in fact only an extreme mean-reversion reaction following a near 20% treasury up spike. The max drawdown is more than 5x smaller than a buy-and-hold stock market investment. Personally I think, this is in fact the biggest argument for such a strategy. All together, we had several major market correction like the 2000 tech bubble dot-com crisis, the 2001 9/11 attack, the 2003 Gulf war, the 2008 subprime crisis, the 2011 European sovereign debt crisis and lots of other smaller corrections. The UIS strategy always performed very well during these corrections. From 1995 to 2007, the UIS strategy had quite a stable 12% annual return. After 2008, the UIS return increased to 15% annually. The main reason for this improvement is the increased volatility and momentum factors present in the market. After the 55% correction of the U.S. stock market in 2008, VFINX had a lot to recover the last years. In fact, the normal average growth rate of the S&P 500 is about 9% and not 15% like it was during the last 5 years. The UIS strategy “likes” market corrections from time to time, because then the strategy can profit during the down market from treasuries going up and when the market goes up again, then the strategy can profit a second time from a higher stock market allocation. This way, the strategy can return more than each of the two single ETFs. If you want to check the monthly investments of this strategy, then you can download here the full backtest Excel file: 20 year performance log UIS VFINX VUSTX (click to enlarge) Source: Logical-invest.com