Tag Archives: nysearcaspy

Finding Value In The Fed Rate Hike

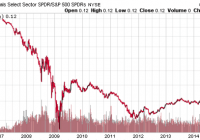
Summary Value funds have under performed post-2008 in part due to weakness in the financial sector. Rising interest rates are a sign of a strong economy and financial companies are more profitable with higher rates. Value is at its cheapest relative to growth in many years. Value has been in the doldrums for years due to underperformance in the financial sector. Financials led the market lower in 2007 and 2008. Following the rebound, banks were targeted by regulators and litigation costs weighed heavily on the sector. To top it all off, the Federal Reserve’s decision to keep interest rates at zero put a lid on the profitability from lending, at a time when borrowers were harder to find. The result was a long period of underperformance from the financial sector. Over the past 8 years, a good performance from the sector has generally been match the broader market’s gains, as the price ratio of the Financial Select Sector SPDR ETF (NYSEARCA: XLF ) versus the SPDR S&P 500 Trust ETF (NYSEARCA: SPY ) shows: (click to enlarge) With the Fed poised to hike rates, the financial sector is starting to come back to life. On July 20, St. Louis Federal President James Bullard said an interest rate hike in September was a 50-50 possibility. Even if a rate hike doesn’t come in September, a hike at the October or December meeting is coming (assuming economic data doesn’t take a sudden turn for the worse). The resulting increase in interest rate spreads, along with a stronger economy, should generate greater profits and improved overall balance sheets for banks and other financial services companies. Another reason to like the financial sector here, especially if you’re long-term bullish on the economy, is that banks currently have their dividend yields suppressed by regulators. Before the financial crisis, many banks paid out 50 percent or more of earnings as dividends. Today, banks are limited to 30 percent. Even if nothing changes to bank profitability, many banks could hike their dividends by as much as two-thirds based on today’s earnings if regulators ease up, which is likely as the memory of 2008 fades. Investing For the Shift Obviously, one way to play a rebound in the financial sector is directly with financial sector funds, but another set of funds that will be impacted by a rebound in financials is value funds because many value funds are overweight the financial sector. One fund that has hefty exposure is the Vanguard U.S. Value Fund (MUTF: VUVLX ), at 30.3 percent in the sector as of June 30. It has been a tough few years for VUVLX and other value funds due to its largest sector weighting delivering middling performance. Value funds also tend to be overweight energy and it’s been a terrible sector in the past year. Value has underperformed growth due to the recent spike in technology companies. Strong earnings from Internet firms such as Google (NASDAQ: GOOG ) and Netflix (NASDAQ: NFLX ) have pushed growth shares sharply higher. As this chart comparing the price of VUVLX to the Vanguard U.S. Growth Portfolio (MUTF: VWUSX ) show s, the recent drop in energy combined with the spike in growth shares has really weighed on relative returns. Once the financial sector starts outperforming, this performance will change for the better. (click to enlarge) VUVLX The four-star Morningstar rated Vanguard US Value Fund Investor Class seeks long-term capital appreciation and income by investing the majority of its assets in shares of U.S. common stock. The fund has a focus on large- and mid-cap value stocks that management perceives to be out of favor with the general market. These stocks may also have higher-than-average dividend yields and lower-than-average price/earnings ratios. As of the end of June 2015, VUVLX has a significant exposure to financial services stocks. Investment Strategy Portfolio managers James Troyer, James Stellar and Michael Roach are at the helm of VUVLX. The management team uses proprietary software and a quantitative-driven investment approach to identify stocks that they believe offer a good balance between strong growth and reasonable valuations when compared to industry peers. Managers construct the portfolio from stocks selected primarily from the Russell 3000 Value Index. While the fund typically concentrates on large- and mid-cap companies that the managers believe are selling below their true worth, it has no restrictions on the size of the companies in which it may invest. The fund may also invest up to 20 percent of assets in foreign securities and engage in currency hedging strategies associated with those investments. Fund managers are authorized to invest 15 percent of assets in restricted securities or other illiquid investments as well as hold small positions in stock futures, derivatives and exchange-traded funds. The fund may also take defensive positions, such as holding a large cash position, on a temporary basis in response to unusual market, economic or political conditions. The fund’s goal is to outperform the underlying benchmark Russell 3000 Value Index. This investment strategy has enabled VUVLX to beat the Large Value Category averages since its inception in June 2000. Portfolio Composition and Holdings VUVLX currently has $1.3 billion under management. The portfolio holds 99.28 percent of assets in U.S. stocks with the remainder in cash. The fund has a 37.24 percent exposure to Giant Cap stocks as well as 29.44 percent and 19.20 percent exposures to large- and medium-cap stocks. VUVLX also holds 12.08 percent and 2.05 percent of assets in small- and micro-cap stocks. The portfolio is heavily weighted toward the Financial Services, Healthcare and Industrial sectors. VUVLX is underweight Consumer Defensive and Energy shares. The fund has a P/E ratio of 15.67 and a price-to-book of 1.83. This broadly diversified fund normally invests in approximately 200 individual holdings across all market categories. The portfolio currently holds 238 individual securities with an average market cap of $32 billion, which compares to the category average of just over $84 billion. The top 10 holdings comprise 21.3 percent of holdings. They include Exxon Mobile (NYSE: XOM ), Wells Fargo (NYSE: WFC ), JPMorgan Chase (NYSE: JPM ), Johnson & Johnson (NYSE: JNJ ) and General Electric (NYSE: GE ). The next five largest holdings are Berkshire Hathaway (NYSE: BRK.A ), Proctor & Gamble (NYSE: PG ), AT&T (NYSE: T ), Pfizer (NYSE: PFE ) and Schlumberger (NYSE: SLB ). Historical Performance and Risk The fund has consistently beat its category. VUVLX generated 1-, 3- and 5-year total return averages of 6.82 percent, 19.64 percent and 17.86 percent respectively. These compare to the category averages over the same periods of 3.92 percent, 16.27 percent and 14.49 percent. VUVLX has an Above Average 3-year Morningstar Return rating and an Average 3-year Risk Rating. The fund has a 0.98 beta and a standard deviation of 8.93. These compare to the category averages of 0.98 and 8.55. VUVLX has a 30-Day SEC Yield of 1.99 percent. Expenses, Fees and Distribution This open-ended fund has an expense ratio of 0.29 percent, which is significantly less than the category average of 1.19 percent. VUVLX does not have any initial, deferred, redemption or 12b-1 fees. The fund has a $3,000 minimum initial investment for taxable and qualified non-taxable accounts. Conclusion Investors aren’t very interested in value today and as a result, value is the cheaper than it has been in years relative to growth. Growth stocks are enjoying a great run this year and thanks to solid earnings reports in July, another growth spurt is underway. Amazon (NASDAQ: AMZN ) reported strong earnings on Thursday and shares popped in after-hours trading, extending growth’s 2015 run. Investors too often chase what’s hot at the moment though, and with a major change in interest policy looming, a reassessment of long-term positioning is warranted. Putting aside the fundamental case for a turnaround in value, on a relative basis it appears value is due for a rebound. Add in the case for a stronger financial sector, which itself has spent most of the past 8 years underperforming or matching the performance of the broader market, and there’s a strong case to be made for value staging a comeback in the years ahead. Disclosure: I am/we are long VUVLX. (More…) I wrote this article myself, and it expresses my own opinions. I am not receiving compensation for it (other than from Seeking Alpha). I have no business relationship with any company whose stock is mentioned in this article.
4 ETFs For The Long Term Investor

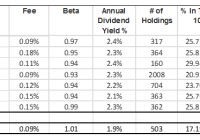
Summary A diversified portfolio can be replaced by an ETF investment strategy. Out of list of many dozens there are quick ways to filter out the best in class ETFs. Here is a list of my top 4 ETFs to choose from for the long term investor. A good friend came to me with a request. He has been managing his father’s investments for a while now and considers switching his strategy from a direct stocks picking investment to a ETF investment. He said that he would consider a shift only if the management fees will be very low and as long as the ETF would invest in big U.S. companies. I took on the challenge to find 3-5 ETFs for his consideration as replacement to a wide spread portfolio of big American corporations. He will probably choose only one or two. The first step was to create a list of Large Cap equities ETFs using ETFdb.com . The initial list included 66 Large Cap Value ETFs based on the proposal of the website. My benchmark is the S&P 500 index which is represented by the SPDR S&P 500 Trust ETF (NYSEARCA: SPY ). The full list of ETFs can be found here . My first step was to find the ETFs that charge minimum fees. My benchmark ETF, SPY, carries 0.09% of fees therefore I filtered out all ETFs that held fees that are higher than 0.2% per year. This screening proved to be very productive, as out of initial list of 66 ETFs I was left with only 15. The next step was to look at the performance demonstrated by the ETFs. SPY delivered ~65% return during the last 3 years. I therefore filtered out the ETFs that delivered less than 60% in the last 3 years. This screening allowed to narrow the list from 15 to only 7 ETFs. The last 7 were: Vanguard Value ETF (NYSEARCA: VTV ) iShares S&P 500 Value ETF (NYSEARCA: IVE ) Vanguard Mega Cap Value ETF (NYSEARCA: MGV ) iShares Core U.S. Value ETF (NYSEARCA: IUSV ) Vanguard Russell 1000 Value ETF (NASDAQ: VONV ) Vanguard S&P 500 Value ETF (NYSEARCA: VOOV ) SPDR S&P 500 Value ETF (NYSEARCA: SPYV ) The next table captures the top seven information: All of the seven are following a similar group of big corporations, nevertheless I tried to narrow the list even further. I mapped the Top-10 holdings of the seven ETFs. The next table captures the percent of holding in each ETF of its highest ten holdings: This mapping allowed me to understand that the high similarity between these ETFs. For example, VTV and MGV had the same list of top holdings. VTV delivered 2.5% higher return in the last three years and charges a slightly lower management fees. I therefore prefer VTV over MGV. VTV delivered a 10% dividend growth rate in the last three year, going from $1.40 per share in 2011 to $1.87 per share in 2014. In 2015 the two paid dividends summed to $1.01 hence we can expect this year to demonstrate a growing dividend as well. IVE, VOOV and SPYV carries the list of Top-10 holdings as well. The internal holdings percentage allocation is also very similar between these three. SPYV is different from the other two in its high Beta to the market. IVE charges a higher management fee compared to the other two. The means that the best choice out of these three is VOOV . VOOV delivered a 17% dividend growth rate in the last three year, going from $1.10 per share in 2011 to $1.78 per share in 2014. In 2015 the two paid dividends summed to $0.94, hence we can expect this year to demonstrate a growing dividend as well, even though not in the same rate as in the past three years. IUSV and VONV also carries the same list of top 10 holdings. IUSV holds substantially higher number of stocks compared to the other ETFs. The total return of this fund was lower than VONV. Therefore, VONV is good even though it charges slightly higher management fees. VONV delivered a 16% dividend growth rate in the last two years, going from $1.43 in 2012 to $1.92 in 2014. In 2015 the two dividends totaled to $0.88, so there is no indication that the growth rate will continue as in the past two years. My benchmark, SPY, was found to be a pretty reasonable investment as well compared to the other ETFs in the list. The low fees and highest return are clearly better than the others but the dividend yield is slightly lower compared to VTV, VONV and VOOV. Yet, SPY invests in a more diversified type of companies and not only in large cap value stocks. Conclusions: Based on the request for a list of 3-5 ETFs to choose from that can replace a portfolio of big cap U.S. companies my picks are: VTV, which seeks to replicate the MSCI U.S. Prime Market Value Index. VOOV, which seeks to replicate the S&P 500 Value Index. VONV, which seeks to replicate the Russell 1000 Value Index. All three have delivered a dividend growth in the last two-three years and charge minimal management fees. If willing to expend the exposure to medium and smaller companies, SPY can also be considered as it seeks to replicate the S&P 500 Index. Disclosure: I/we have no positions in any stocks mentioned, and no plans to initiate any positions within the next 72 hours. (More…) I wrote this article myself, and it expresses my own opinions. I am not receiving compensation for it (other than from Seeking Alpha). I have no business relationship with any company whose stock is mentioned in this article. Additional disclosure: The opinions of the author are not recommendations to either buy or sell any security. Please do your own research prior to making any investment decision.

The Low Volatility Anomaly: Leverage Aversion Hypothesis

This series digs deeper into the Low Volatility Anomaly, or why lower risk stocks have historically produced stronger risk-adjusted returns than higher risk stocks or the broader market. The CAPM links expected returns with an asset’s sensitivity to systematic risk, but the model assumptions are impractical. This article covers a deviation between model and market that may contribute to the outperformance of low volatility strategies. Given the long-run structural alpha generated by low volatility strategies, I am dedicating a more detailed discussion of the efficacy of this style of investing. In the first article in this series , I provided an introduction to the strategy with a simple example demonstrating a low volatility factor tilt (replicated through SPLV ) from the S&P 500 (NYSEARCA: SPY ) that has generated long-run alpha. In the second article in this series , I provided a theoretical underpinning for the presence and persistence of a Low Volatility Anomaly, and linked to articles depicting its success dating back to the 1930s. This article demonstrates that violations of the assumption of the Capital Asset Pricing Model (CAPM) lead to deviations between model and market that pervert the presumed relationship between risk and return. Empirical evidence, academic research and long time series studies across asset classes and geographies have shown that the actual relationship between risk and return is flatter than the model or market expectations suggests. The third article in this theory lays out a hypothesis for why low volatility strategies have produced higher risk-adjusted returns over time. Leverage Aversion Hypothesis The fallacy of the Capital Asset Pricing Model assumption that investors are able to borrow and lend at the risk-free rate might be the supposition that most perverts the model application from real world practice. Certainly not all investors are able to use leverage, and the cost and availability of leverage can deviate materially from any notion of a risk-free rate in times of stress. Intuitively, leverage-constrained or leverage-averse investors often choose to overweight riskier assets, increasing the price of risky assets and lowering expected return. If some market participants are overweight riskier assets characterized by lower expected returns, then they must be underweight lower risk assets which would be characterized by higher expected returns. In the CAPM model, rational market participants seeking to maximize their economic utility invest in the portfolio with the highest expected return per unit of risk, and lever or de-lever their portfolio to suit their own risk tolerance. In practice, however, many large institutional investors including most mutual funds and certain pension funds are constrained by the level of leverage that they can take. Furthermore, many individual investors lack the sophistication or access to attractively priced leverage. The growing increase in the assets under management of exchange traded fund products with embedded leverage could well signal small investor’s inability to access leverage directly on favorable terms. If market participants respond by being overweight riskier securities, then the relationship between risk and expected return is altered. Building on the long time series studies from Black and Haugen of the relative outperformance of lower volatility assets in the last article in this series, Frazzini and Pederson (2010) empirically demonstrated the alpha-generative nature of low beta assets across twenty international equity markets, Treasury bonds, corporate bonds, and futures. The duo also introduced a “Betting Against Beta” factor that gave the paper its name. The factor is effectively a zero beta portfolio that is long leveraged low-beta assets and short high-beta assets to produce statistically significant risk-adjusted across many markets, geographies, and time intervals. This study also demonstrated that the return of the BAB factor is sensitive to funding constraints as one would expected in a trade involving leverage. The persistence of an alpha-generative strategy involving leverage applied to low volatility assets, whose excess return is in part a function of the funding environment, supports the Leverage Aversion Hypothesis as an explanation for the Low Volatility Anomaly. In the next section of this series, we will tackle how the delegated agency model typical of investment management may also contribute to the outperformance of Low Volatility strategies. Disclaimer My articles may contain statements and projections that are forward-looking in nature, and therefore, inherently subject to numerous risks, uncertainties and assumptions. While my articles focus on generating long-term risk-adjusted returns, investment decisions necessarily involve the risk of loss of principal. Individual investor circumstances vary significantly, and information gleaned from my articles should be applied to your own unique investment situation, objectives, risk tolerance, and investment horizon. Disclosure: I am/we are long SPLV, SPY. (More…) I wrote this article myself, and it expresses my own opinions. I am not receiving compensation for it (other than from Seeking Alpha). I have no business relationship with any company whose stock is mentioned in this article.