Tag Archives: nysearcaspy

FNDF Has Great Risk Factors And Enough Liquidity, But I Really Dislike The Cash Position

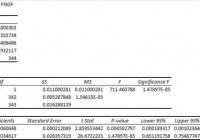
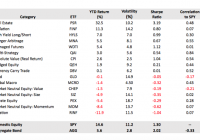
Summary I’m taking a look at FNDF as a candidate for inclusion in my ETF portfolio. The extremely low correlation with other major funds (like SPY) is great and holds up despite a decent time frame and high volume of trades. The expense ratio is a bit high for my liking and is combined with a fairly large position in cash. Investors should treat cash in an ETF as a savings account that charges them an expense ratio instead of paying interest. I’m not assessing any tax impacts. Investors should check their own situation for tax exposure. Investors should be seeking to improve their risk adjusted returns. I’m a big fan of using ETFs to achieve the risk adjusted returns relative to the portfolios that a normal investor can generate for themselves after trading costs. I’m working on building a new portfolio and I’m going to be analyzing several of the ETFs that I am considering for my personal portfolio. One of the funds that I’m considering is the Schwab Fundamental International Large Company Index ETF (NYSEARCA: FNDF ). I’ll be performing a substantial portion of my analysis along the lines of modern portfolio theory, so my goal is to find ways to minimize costs while achieving diversification to reduce my risk level. What does FNDF do? FNDF attempts to track the total return of the Russell Fundamental Developed ex-U.S. Large Company Index. Normally at least 90% of the assets are invested in funds included in this index, but there appears to be some leeway under unusual market conditions. FNDF falls under the category of “Foreign Large Value.” Does FNDF provide diversification benefits to a portfolio? Each investor may hold a different portfolio, but I use the SPDR S&P 500 Trust ETF (NYSEARCA: SPY ) as the basis for my analysis. I believe SPY, or another large cap U.S. fund with similar properties, represents the reasonable first step for many investors designing an ETF portfolio. Therefore, I start my diversification analysis by seeing how it works with SPY. I start with an ANOVA table: (click to enlarge) The correlation is only 82%, which is very solid for modern portfolio theory. Extremely low levels of correlation are wonderful for establishing a more stable portfolio. I consider anything under 50% to be extremely low. However, when I see those values it usually comes with issues, such as low average volume, which can create distorted statistics. For an ETF with around 184,000 shares trading hand each day, the 82% is very impressive. Standard deviation of daily returns (dividend adjusted, measured since August 2013) The standard deviation is pretty good. For FNDF it is 0.8055%. For SPY, it is 0.6891% for the same period. SPY usually beats other ETFs in this regard. If an ETF is only 0.10% to 0.15% over SPY with heavy trading volume it is doing fairly well for stability. Mixing it with SPY I also run comparisons on the standard deviation of daily returns for the portfolio assuming that the portfolio is combined with the S&P 500. For research, I assume daily rebalancing because it dramatically simplifies the math. With a 50/50 weighting in a portfolio holding only SPY and FNDF, the standard deviation of daily returns across the entire portfolio is 0.7135%. With 80% in SPY and 20% in FNDF, the standard deviation of the portfolio would have been 0.6898%. If an investor wanted to use FNDF as a supplement to their portfolio, the standard deviation across the portfolio with 95% in SPY and 5% in FNDF would have been 0.6881%. Why I use standard deviation of daily returns I don’t believe historical returns have predictive power for future returns, but I do believe historical values for standard deviations of returns relative to other ETFs have some predictive power on future risks and correlations. Yield & Taxes The distribution yield is 0.50%. Retirees seeking yields won’t find them here, but the low correlation still looks good for investors that don’t need strong yields. I’m not a CPA or CFP, so I’m not assessing any tax impacts. Expense Ratio The ETF is posting 0.32% for an expense ratio. I want diversification, I want stability, and I don’t want to pay for them. The expense ratio on this fund is higher than I want to pay for equity securities, but not high enough to make me eliminate it from consideration. Market to NAV The ETF is at a 0.85% premium to NAV currently. Premiums or discounts to NAV can change very quickly so investors should check prior to putting in an order. I don’t want to pay a premium over 0.2%, and this premium has persisted despite a respectable amount of daily volume. I don’t see these premiums as sustainable over the long term, so I would be concerned about entering a position without seeing the premium drop first. Largest Holdings The diversification within the ETF is pretty good, so long as we only look at the equity securities. (click to enlarge) I’m not big on the holdings including a 10% value for U.S. dollars. I have nothing against dollars, but I already have them in my checking and savings account. Neither of those accounts are charging me an expense ratio. Conclusion I’m currently screening a large volume of ETFs for my own portfolio. The portfolio I’m building is through Schwab, so I’m able to trade FNDF with no commissions. I have a strong preference for researching ETFs that are free to trade in my account, so most of my research will be on ETFs that fall under the “ETF OneSource” program. For the level of liquidity, the low correlation is great. However, I’m not comfortable investing at a significant premium to NAV and with the high volumes of trades the bid-ask spread may be tight enough that I wouldn’t have a very good shot of triggering a limit buy order at the price I would want to use. Even if I put those issues aside, I’m not big on buying into an ETF with a pile of cash earning an expense ratio. I have quite enough exposure to cash through my bank accounts without having an ETF hold it for me. Additional disclosure: Information in this article represents the opinion of the analyst. All statements are represented as opinions, rather than facts, and should not be construed as advice to buy or sell a security. Ratings of “outperform” and “underperform” reflect the analyst’s estimation of a divergence between the market value for a security and the price that would be appropriate given the potential for risks and returns relative to other securities. The analyst does not know your particular objectives for returns or constraints upon investing. All investors are encouraged to do their own research before making any investment decision. Information is regularly obtained from Yahoo Finance, Google Finance, and SEC Database. If Yahoo, Google, or the SEC database contained faulty or old information it could be incorporated into my analysis. The analyst holds a diversified portfolio including mutual funds or index funds which may include a small long exposure to the stock.

Recap: The Best And The Worst In Alternative Investment ETFs

John Bogle, founder of the Vanguard fund family, has cautioned investors for many years about playing cute with their investment portfolios. “Don’t look for a needle in the haystack,” says Saint Jack, “just buy the haystack.” With that, Bogle inveighs against stock-picking and advocates the use of index funds. Why try to beat the market, in his view, since you can’t do it consistently? Not surprisingly, many investment advisors rail against Bogle’s notion. Some, particularly those running endowments and foundations, are duty bound to seek equity-like returns without the concentrated risk of stock investments. Which brings us to alternative investments. Mixing “alts” into a portfolio can, in the best of circumstances, enhance returns and diversify risk. This year, though, alts have had an especially tough row to hoe. Domestic equities, measured by the performance of S&P 500 SPDR ETF (NYSEARCA: SPY ) , gained 15 percent in 2014 with an annualized volatility of 11 percent. As stand-alone investments, only one alt category outperformed the domestic stock market. (click to enlarge) Alts, of course, aren’t meant to be stand-alones; they’re destined, for most investors, to be portfolio adjuncts. Real estate was the standout of the year, offering a one-two combination punch of outsized gain and low volatility. The PowerShares Active US Real Estate ETF (NYSEARCA: PSR ) more than doubled SPY’s return with a smaller standard deviation. All this with a middling correlation to the broad equity market. If you were shopping for negative correlation to equities this year, the shelves were rather bare. Only two ETFs – the SPDR Gold Shares Trust (NYSEARCA: GLD ) and the QuantShares US Market Neutral Value ETF (NYSEARCA: CHEP ) – cranked out negative coefficients against SPY. And the price for this? Negative returns, though arguably you could say GLD had a breakeven year. If you base your diversification success on the Sharpe ratio – a gauge of risk-adjusted returns – this year’s runner-up alt bets were managed futures and absolute value, epitomized by the WisdomTree Managed Futures Strategy ETF (NYSEARCA: WDTI ) and the HedgeIQ Real Return ETF , respectively. The derby for 2015’s best and worst kicks off today. Stay tuned for ongoing updates.

Stock Market Reversal In January: The Potential Effect Of Capital Gain Taxes

The S&P 500 index was up 11% in 2014 and up 64% over the past 3 calendar years before dividends. When the stock market is at or near all-time highs at the end of December the following January has on average posted a negative return. This reversal effect, likely due to delayed selling because of capital gains taxes, is stronger when the recent 1-year and 3-year returns are high. The past three calendar years have been quite good for the US stock market. Using S&P 500 index data from Yahoo Finance we have only seen better returns for three consecutive calendar years in the late 1990s and the mid-1950s. The S&P 500 data we use begins with full calendar year data in 1951, so we have 63 calendar years of data in our sample through 2013. What can we expect going forward for the stock market or more specifically the S&P 500 index ETFs, (NYSEARCA: SPY ), (NYSEARCA: IVV ), and (NYSEARCA: VOO ), after such a great run? It’s hard to come to any significant conclusions with just five data points, so we want to expand the sample size a bit before analyzing the data. One distinction we can make for this year versus the average year is that we are at all-time highs for the S&P 500. On a monthly closing basis the all-time high was in November with the S&P 500 closing at 2067. December’s close of 2058 is basically right there. There are 25 calendar years in our data set where the December closing level is within 2% of the all-time high. That is enough data to start to draw some conclusions. If we filter this some more by removing years where the last calendar year price change (return before dividends) was less than +10% we have 20 data points. Filtering with a +15% price change gives us 16 data points. We use price change rather than total return because returns from dividends don’t affect decisions about whether to take capital gains or not. The results of various filters are shown in the table below. In the filter criteria, “Near ATH” means December close is within 2% of the monthly closing all-time high, “1-yr ret” means the price change over the prior calendar year, and “3-yr ret” means the price change over the prior three calendar years. (click to enlarge) The confidence level in the last row of the table is a statistical measure that tells us the likelihood that the average January return of each subset of years is actually lower than the typical January return and the difference is not just due to statistical noise. In other words looking at the “Near ATH” column in the table we see there is an 89% chance that Januaries that begin near the all-time high for the S&P 500 can be expected to be worse than the typical January. While this doesn’t pass common statistical tests than require 95% or 99% confidence, it is still worth keeping in mind as investors consider what to do with their portfolios in the New Year. The filter that most closely matches the current environment is the far right column. There have been 11 years since 1951 that end near all-time highs, had greater than +10% price change and finish a three-year period with price change greater than 40%. The subsequent Januaries average price return was negative at -1.11%. The standard error on this sample mean estimate is 1.45%, so while the -1.11% seems significantly different from +0.89% (the average of all years), the difference between the two numbers isn’t that much more than the standard error. The eleven years that match this criteria are shown in the following table. Six out of 11 years are down in January and five are up. The best January in the table follows 1998 with a +4.0% return and the worst follows 1989 with a -7.1% return. Clearly the one year variation is fairly wide, so we can’t expect this January to have exactly a -1.11% decline. How should an investor use this information? Here are a few possibilities. If she wants to add to her equity position, waiting until February might be wise. If rebalancing is in order for a portfolio, and that involves reducing equity exposure, do it sooner rather than later. If it involves adding to equity exposure, wait a month. If there are capital gains in a taxable account and there is any need for the cash this year, sell sooner in January rather than later. If this potential January reversal takes place before an investor can act, it’s probably not a good idea to sell equities out of fear of further declines. For the months of February and March following the eleven Januaries in the table above the combined average returns were +4.1%. We can’t expect this January reversal phenomenon to persist into February and March. We attribute this reversal of returns in January to the impact of capital gains taxes, and delayed selling over the recent past to delay the capital gains tax until April 2016. There could always be some other reason for further selling, or for buying that overwhelms the tax impact to give us a positive return in January. There are a lot of possibilities for what happens to markets in January and in all of 2015. This is just another piece of data to consider that we view as important in the next month. Now that you’ve read this, are you Bullish or Bearish on ? Bullish Bearish Sentiment on ( ) Thanks for sharing your thoughts. Why are you ? Submit & View Results Skip to results » Share this article with a colleague