Tag Archives: nysearcaspy

QJPN Borders On Being Too Good To Be True

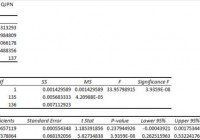
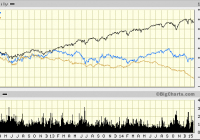
Summary I’m taking a look at QJPN as a candidate for inclusion in my ETF portfolio. The expense ratio is a bit high, but the diversification is moderate. The correlation with SPY appears low, and the overall risk level for a portfolio looks great. However, weak liquidity could be influence results. Despite the relatively short history on QJPN, I’ll keep it on my short list for international exposure. I’m not assessing any tax impacts. Investors should check their own situation for tax exposure. Investors should be seeking to improve their risk adjusted returns. I’m a big fan of using ETFs to achieve the risk adjusted returns relative to the portfolios that a normal investor can generate for themselves after trading costs. I’m working on building a new portfolio and I’m going to be analyzing several of the ETFs that I am considering for my personal portfolio. One of the funds that I’m considering is the SPDR MSCI Japan Quality Mix ETF (NYSEARCA: QJPN ). I’ll be performing a substantial portion of my analysis along the lines of modern portfolio theory, so my goal is to find ways to minimize costs while achieving diversification to reduce my risk level. What does QJPN do? QJPN attempts to provide results which are comparable (before fees and expenses) to the total return of the MSCI Japan Quality Mix Index. QJPN falls under the category of “Japan Stock”. Does QJPN provide diversification benefits to a portfolio? Each investor may hold a different portfolio, but I use (NYSEARCA: SPY ) as the basis for my analysis. I believe SPY, or another large cap U.S. fund with similar properties, represents the reasonable first step for many investors designing an ETF portfolio. Therefore, I start my diversification analysis by seeing how it works with SPY. I start with an ANOVA table: (click to enlarge) The correlation is about 44%, which is phenomenal for Modern Portfolio Theory. The extremely low correlation makes it much easier to mix the ETF into a portfolio and take advantage of the benefits of diversification. My goal is risk adjusted returns, and my method is minimizing risk. Standard deviation of daily returns (dividend adjusted, measured since June 2014) The standard deviation is very reasonable. For QJPN it is .8159%. For SPY, it is 0.7232% for the same period. SPY usually beats other ETFs in this regard, and the low correlation with SPY makes the higher standard deviation acceptable. Short time frame Investors should be aware that this is a substantially shorter time frame than I usually use. I would like to have about 3 years of data on the ETF for running statistics and half of one year is short enough to introduce sampling errors. In statistics, the minimum sample size is generally 30 so over 130 days of trading returns may seem sufficient, but I would caution investors to take this with a grain of salt. Liquidity concern The average volume comes in at just under 2000 shares. That’s a potential problem for investors that need liquidity and for running correlation values. I checked the dividend adjusted closing values for each day and there were very few times that the change was 0.00%, which means the low volume of trades was not the only factor in the low standard deviation. For statistical validity, I’m more concerned about the relatively short time frame that I have available than the number of shares trading each day. For an investor concerned about spreads and liquidity, the low number of shares trading could be the bigger concern. Mixing it with SPY I also run comparisons on the standard deviation of daily returns for the portfolio assuming that the portfolio is combined with the S&P 500. For research, I assume daily rebalancing because it dramatically simplifies the math. With a 50/50 weighting in a portfolio holding only SPY and QJPN, the standard deviation of daily returns across the entire portfolio is 0.6553%. If an investor wanted to use QJPN as a supplement to their portfolio, the standard deviation across the portfolio with 95% in SPY and 5% in QJPN would have been .7063%. While the low correlation makes very large positions look quite appealing, I wouldn’t want to risk my money on those statistics holding. However, the low correlation and reasonable standard deviation make this a strong contender for a position in my portfolio, even if I have to limit the exposure to something much smaller than the statistics would have suggested. Due to the potential for the low trading volumes and short time frame to distort the statistics, I will want more data before making a final decision on the ETF. So far, I am definitely considering it. Why I use standard deviation of daily returns I don’t believe historical returns have predictive power for future returns, but I do believe historical values for standard deviations of returns relative to other ETFs have some predictive power on future risks and correlations. Yield & Taxes The SEC yield is 1.37%. That is too weak for a retiring investor to live off the yield, but the ETF still could merit a small position as part of a rebalancing plan to reduce the overall risk level in the portfolio is the investor was certain he or she would not have liquidity needs that would force them to sell. I’m not a CPA or CFP, so I’m not assessing any tax impacts. Expense Ratio The ETF is posting .30% for an expense ratio. I want diversification, I want stability, and I don’t want to pay for them. The expense ratio on this fund is slightly higher than I want to pay for an equity fund, but it isn’t enough to disqualify the ETF from consideration. Market to NAV The ETF is at a .29% premium to NAV currently. Premiums or discounts to NAV can change very quickly so investors should check prior to putting in an order. I wouldn’t want to pay a premium greater than .1% when investing in an ETF, unless I could find a solid accounting reason for the premium to exist. This premium looks small enough that I think I could enter into a position with a limit buy order that removed the premium. Largest Holdings The diversification within the ETF is moderate. Normally I want more diversification, but if the correlation and standard deviation hold up over a longer time period, I wouldn’t have any problem with the level of diversification in the ETF. (click to enlarge) Conclusion I’m currently screening a large volume of ETFs for my own portfolio. The portfolio I’m building is through Schwab, so I’m able to trade QJPN with no commissions. I have a strong preference for researching ETFs that are free to trade in my account, so most of my research will be on ETFs that fall under the “ETF OneSource” program. QJPN is going to be on my short list (for now) for potential inclusion in my portfolio as part of my international exposure. If QJPN continues to look better than other international ETFs under modern portfolio theory I will extend my analysis to look for other ETFs with similar holdings and a longer trading history so if the data on those ETFs support the statistics so far on QJPN.

How Long Before ‘They’re Raising Rates’ To ‘They’re Considering QE4?’

If foreign economic stagnation and commodity price depreciation is an old story, then why are U.S. equities suddenly responding as though the U.S. economy might be in danger? The daily volatility over the last 10 weeks is primarily attributable to the Federal Reserve terminating its third iteration of “QE” back in October. The central banks of the world have been remarkably successful at repressing the risk of equity market participation. The media are telling us that U.S. stocks have been under pressure this January due to global growth fears and an accompanying rout across the entire commodity space. Yet that only tells a small part of the story. After all, the S&P 500 SPDR Trust ETF (NYSEARCA: SPY ) has performed quite admirably over the past three years, blissfully unresponsive to the global growth woes reflected in ETFs like the Vanguard FTSE Emerging Markets ETF (NYSEARCA: VWO ) and the iPath Dow Jones-UBS Commodity Index Total Return ETN (NYSEARCA: DJP ). If foreign economic stagnation and commodity price depreciation is an old story, then why are U.S. equities suddenly responding as though the U.S. economy might be in danger? Where’s the enthusiasm for the enormous stimulus associated with cheap oil and gas? What happened to the euphoria over the best job growth since 1999? In truth, the daily volatility over the last 10 weeks is primarily attributable to the Federal Reserve terminating its third iteration of “QE” back in October – an electronic money creating, bond-buying program that resulted in the Fed acquiring trillions in U.S. debt. Consider the reality that when the Fed removed a large portion of the supply of treasuries, investors who would have bought those treasuries had to buy assets like corporate bonds instead. This reduced the borrowing costs for corporations and allowed many of them to refinance debts as well as buy back shares of their own stock. Up went the stock market. Similarly, the Fed removed a large portion of the supply of mortgage-backed securities, ultimately lowering the mortgage costs for real estate. Up went the housing market. An increase in the net worth of corporations, small businesses as well as wealthier families did create an atmosphere for greater economic confidence. However, with the Federal Reserve hinting that overnight lending rates might go up as soon as April, butterflies flapping their wings in Rio de Janeiro and Beijing have been creating tremors for U.S. equities. In essence, the stock market is not so sure that our “booming” domestic economy is a self-sustaining wonderland in the absence of central bank stimulus. Nowhere is this more obvious than in the relatively tranquil progress of the FTSE Custom Multi-Asset Stock Hedge Index. In the ten weeks since QE ended (through Jan 14), the index has quietly gained 2.5% while the S&P 500 has fluctuated wildly on its way to being flat. (Note: These results do not yet account for Wednesday’s stock declines.) While the bullish media typically ignore the bulk of what happens with non-equity asset classes, there are specific currencies, commodities and country debt that have historically performed well in moderate-to-severe stock downturns. Asset types like longer-term treasuries, zero-coupon bonds, munis, German bunds, gold, the franc, the yen, the dollar and others fit the bill. The index, often referred to by others as the “MASH Index,” does not short or use leverage like a bear fund; safer haven holdings (ex stocks) often perform better than cash in stock uptrends as well. You can learn more about the FTSE Custom Multi-Asset Stock Hedge Index at StockHedgeIndex.com . Those investors who remain in the bullish camp theorize that the U.S. economy is strong enough to handle modest rate increases. They also anticipate the inevitability of quantitative easing or similar asset-back purchasing measures in the euro-zone as well as China acting to bolster its economic output through a variety of techniques; stock bulls view the troubles overseas as noise and vow to continue buying dips on weakness. In contrast, bears counter with the fact that U.S. stocks are not only at the high end of historical valuations, they may be at the highest levels in recorded history. For instance, Jim Paulsen at Wells Capital explained that U.S. stocks have never been this expensive ever, at least not when one employs the median price-to-earnings ratio. (And Paulsen has been a fixture in the bull camp!) My view? I am neither bullish nor bearish in practice. That said, I am a proponent of applying insurance principles to the investing process. Stop-limit loss orders , trendlines, put options, multi-asset stock hedging – they all minimize the risk of catastrophic loss. Indeed, the reason I partnered with the world’s largest index provider (FTSE-Russell) in developing the FTSE Custom Multi-Asset Stock Hedge Index was to offer a new way to reduce the risks associated with stock market euphoria. The central banks of the world have been remarkably successful at repressing the risk of equity market participation. Throughout the six years of the 2009-2015 bull, whenever there has been a belch (or even a hiccup), the Federal Reserve has come to the rescue with more bond-buying stimulus. On the flip side, if they stick to their guns on raising rates this time, you can expect the uncertainty to fuel even more desire for perceived safe havens. You might look at the iShares 10-20 Year Treasury Bond ETF (NYSEARCA: TLH ) as well as carry trade reversal beneficiaries like the CurrencyShares Japanese Yen Trust ETF (NYSEARCA: FXY ). If the conversation shifts towards “no rate increases until 2016″ or even “a bit more QE is a possibility,” then the unbridled excitement for stock ownership would pump new life into the aging bull. Disclosure: Gary Gordon, MS, CFP is the president of Pacific Park Financial, Inc., a Registered Investment Adviser with the SEC. Gary Gordon, Pacific Park Financial, Inc, and/or its clients may hold positions in the ETFs, mutual funds, and/or any investment asset mentioned above. The commentary does not constitute individualized investment advice. The opinions offered herein are not personalized recommendations to buy, sell or hold securities. At times, issuers of exchange-traded products compensate Pacific Park Financial, Inc. or its subsidiaries for advertising at the ETF Expert web site. ETF Expert content is created independently of any advertising relationships.

Start Living An Easier Life And Start Beating The Market Through Contrarian ETF Investments

Summary Periodically buying the SPY all the time might be too boring for some people. Mixing things up with this new strategy might be more their cup of tea. As an example, John, our imaginary investor, will be using this new technique during the Financial Crisis of 2009 and during the GREXIT fears of 2012. With this new strategy, John doubled his performance. He gained 40% during 2008 – 2009 instead of 20%, and 22% during 2012 instead of 11%. So why even pick stocks if you can pick ETFs? It’s safer, easier and you’ll be able to beat the market. Discover 3 very interesting opportunities in the market right now, that might also lead to above average results. John might be getting a first position right now. In my previous article , we learned that life could be much easier and that perhaps joining them instead of trying to beat them might be the better option. However, in today’s article, I’ll dig deeper and see if simple investors like John can actually beat the market – by doing just one thing differently. Yes, there’s a way to still beat the market. And today, we’ll back-test that way 2 times + I’ll give you three possible opportunities that might lead to those same market-beating results. The portfolio strategy I’m going to describe to you during this article is all about two words: ‘Contrarian’ and ‘ETFs.’ It’s the Contrarian ETF Strategy. Let’s break down those words. A contrarian: A person who takes a contrary position or attitude; specifically: an investor who buys shares of stock when most others are selling and sells when others are buying. An ETF: A security that tracks an index, a commodity or a basket of assets like an index fund, but trades like a stock on an exchange. So the strategy goes as followed: Instead of picking individual shares of a company that is in trouble – which continues to be the more risky way of being a contrarian – we now decide to periodically buy an ETF related to an industry/commodity or country that is in trouble. You see, each year, there seems to be some sort of crisis going on somewhere in the world. Often does everyone think the world will end (for that particular industry that is in trouble) but in 99% of these cases, the world doesn’t end and these industries find ways to survive. Crises often are opportunities – when played right – and I bet you’re feeling the same thing. Are oil companies offering the opportunity of a lifetime right now? And how about oil suppliers and companies delivering services to oil companies? And what about Russia? Is Russia an opportunity or a value trap? Will the Ukraine – Russia war really last forever? Will oil remain below $100 during the next 10 years? Will Greece leave the EU? Well, I don’t know all the answers, but I do know that I’m very inclined to say “NO” to all of these questions. People love drama. And we all love doom-scenarios. But how often did any of them played out? Also, when you really think about it: Does oil really have to be at $100 before you – as an investor – can make a profit of certain oil related stocks? Hell no. Certain stocks would jump 20% if oil would make a 5% recovery, or would show signs of a simple stabilization. Does Russia really have to report a 2% GDP growth figure before you, as an investor, can make a decent profit? Hell no. Anything positive, anything that gives investors the outlook that “things will get normal again” will make Russian stocks go nuts (hence the 10% bounce in 4 days time that occurred last week). However, while most investors recognize these opportunities and see the possible value in these areas of the market right now, they often see things too pessimistic and are too uncertain. “I don’t know anything about Russian or Greek stocks. I know nothing about oil companies or their suppliers, I don’t know which ones are the good ones.” Well you don’t have to know which ones the good ones are. That’s what ETFs are for. John’s strategy during the financial crisis of 2009. Remember John from my previous article? Well, he’s back in town. John is still buying the SPDR S&P 500 Trust ETF (NYSEARCA: SPY ) each month, and just like he was in my previous article, he still is a pretty smart guy that loves to seize opportunities whenever they come along. Last time, he decided to double his investment efforts during the financial crisis. Instead of buying $500/month during 2009, he decided to buy $1000/month. This time, he’s about to do something even more smart. John figures that the industry that is being hurt most, will also have most upward potential. But instead of picking individual stocks and making risky/uncertain decisions that will make him sleep bad at night, he decides that now is the time to buy a financially related ETF. The iShares Global Financial ETF (NYSEARCA: IXG ) seems to be perfect, as it covers 240 banks. This way, he tries to profit – like a real contrarian – from an industry that is in serious trouble while not exposing himself to too much risk. John puts his monthly investments in the SPY on halt and puts his $500 in the IXG instead. However, like we mentioned, John is a very, very smart guy and he knows that a crash can go on for a long time, and thus that chances are real that he gets in too early. Therefore he has one rule when it comes to his contrarian plays: He will only get a first position after a 40% drop. On October 7, 2008, John finally gets what he wants. The IXG fell 40%. From $58 to $34, and John decides to make a first purchase. He then adds to this position the first of each of the following 11 months. After eleven months, and after investing his 6k, John possesses: 202 shares at an average price of $29.64. Which is far below his original entrance point. Thank god he didn’t went all in at once and stayed with the $500/month rule. (click to enlarge) With this strategy, John scored a ~40% return while not having to time the market, not having to take individual risky picks and while keeping it simple. If he had invested in the S&P 500 through the SPY this whole time, then he had gained 19%. So he doubled his return by making a simple shift in where he puts his assets. Of course, this is just one example where dollar cost averaging on an ETF of a sector in trouble turned out very nicely compared to the regular SPY and this is not a representation of any future scenario. So in order to make this theory a little more valid, let’s take a look at a second example. Same strategy, different scenario During the European Debt Crisis in 2012; everyone thought that Greece would be leaving the Eurozone and that the country would be doomed. On May 16, its main index (the ATHEX), had lost more than 40% compared to its year high in Feb., and was now quoting at 209 points. John didn’t belief that Greece would have to leave the Eurozone (damaging only itself and other members of Europe) and thus he decided to expose himself to the country as a whole. He again stops purchasing the SPY – and decides to buy the Global X FTSE Greece 20 ETF (NYSEARCA: GREK ) with his $500/month. After 11 months of dollar cost averaging, John held 625 shares of GREK at an average price of $14.12 while the index was now above $17. John was able to gain a nice 22% in a relatively safe way, while knowing nothing about Greek stocks. At a certain point, he was sitting on a 40% profit. More interesting though, is that John would have only gained 11% if he had continued to buy the SPY during the same period. So yet again John doubled his return. Conclusion Although periodically investing in the SPY should give one decent returns over time, it seems very likely that whenever a sector/industry/country appears to be in trouble, it might be a wise thing to shift your deposits from the SPY into an ETF related to this industry for the course of a year – after they’ve dropped ~40%. This could lead to market-beating results without much effort and without too much risk. Today, I’m seeing 3 great contrarian plays that fit John’s new strategy: Greece Greece is yet again being confronted with a “Grexit” and the ATHEX dropped more than -44% since January 2014. John would be getting his first position now, and this could lead to above average returns within a year from now. As Aristofanis explains here , a Grexit is very unlikely, just like last time. Russia The Russian index has fallen -48% since January 2014 and is also offering a high risk/reward. A first position of $500 now, could lead to market-beating results within a year from now, if you continue to dollar-cost average on the Market Vectors Russia ETF (NYSEARCA: RSX ) the following months. The fact that you’ll be dollar cost averaging + that you’re buying not a few specific Russian companies, is definitely lowering your overall risk. The Russian – Ukraine conflict can’t go on forever and the sanctions that Europe imposed on Russia could be relieved sooner than expected. Russia is in real trouble, now that the rouble and oil prices dropped so much: It’ll simply have no other choice than to retreat and to improve the situation with the Ukraine in order to save its economy. Oil Oil prices have taken a steep dive and thus it might be more than interesting to consider a position in the SPDR Oil & Gas Exploration & Production ETF (NYSEARCA: XOP ), as it is down more than -45% since its all-time-high of mid last year and holds ~83 holdings. However, further downside is definitely possible as oil hasn’t found its bottom yet. By Q3 of 2015 or early 2016 however, I belief that oil prices will start a sharp recovery. The commonly held belief is that Saudi Arabia is keeping prices so low by not lowering its production to put a stop to the rapid growth of production from the U.S. shale oil plays. Others believe it is their goal to crush the Russian and Iranian economies. If the oil price remains at the current level for a few months longer it will do all of the above and then it has succeeded. Also don’t forget that the low oil price will lead to an increased demand from all major economies who are thrilled to get themselves some cheap oil, if they all do this at the same time, there’s a possible shortage imbound which could lead to much higher prices in a short period of time. Mark Mobius, an economist and regular guest on Bloomberg TV recently said he sees Brent rebounding to $90/bbl by the end of 2015 and I agree with this vision. Although $70/bbl would also be good enough in order to make a profit of this ETF. Main source used for my oil prospects: Here . Read the full article, it is really interesting. Additional disclosure: All figures are coming from Yahoo Finance: I used ADJUSTED figures for dividends and splits for simplicity purposes. Returns are supposed to be accurate though.