Tag Archives: nysearcaspy

How To Choose Between VOO And SPY

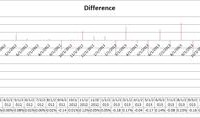
Summary The Vanguard S&P 500 ETF has a strong correlation to SPDR’s S&P 500 ETF. Despite the very strong correlation in returns, there is a clear way to pick which ETF is a better investment. The difference is more than expense ratios. The fund underperforming in one month regularly outperforms in the next using dividend adjusted close values. Investors in the Vanguard S&P 500 ETF (NYSEARCA: VOO ) have plenty of reasons to be happy with their investment. The fund tracks a reasonably stable portion of the U.S. economy and offers investors a lower expense ratio than a major competitor, the SPDR S&P 500 Trust ETF (NYSEARCA: SPY ). The ratio isn’t substantially lower, but the difference is meaningful if the investment horizon is long enough. For VOO the expense ratio is .05% and for SPY it is .09%. The difference should imply that VOO would outperform over the long term by increasing the compound annual growth rate by about .04%. The difference isn’t huge, but it does add up over time. The correlation Returns between the two ETFs have an extremely high correlation, over 99.9%. The strong correlation in returns gives investors reason to believe that the two ETFs should move almost perfectly in unison. However, there are occasionally meaningful differences in the share price of the two major ETFs and those differences result in opportunities for investors. Looking back I ran some regression on returns since the start of October 2010. Since then, the Vanguard S&P 500 ETF has largely mirrored the SPDR S&P 500 ETF. Both were up between 94.1% and 93.6% and the movements generally occur at almost precisely the same time. The interesting thing was when I decided to track the differences in the dividend adjusted closes for each month. The premise is that for each month I would look at the returns on VOO and subtract the returns on SPY. This gave me the difference in the percentage return for the month. I put together a chart to demonstrate, but the volume of data points may make it a little difficult to read. (click to enlarge) What investors should notice is that the bars are regularly trading direction. Not only do the bars swing back and forth, the longest bars going in any direction are precisely between two bars heading in the opposite direction. When the bars are fairly short, it provides little indication of which way the bars will move in the future. The theory My prediction upon glancing at the numbers was that we should expect to see serial negative correlation in the difference of the returns. In simpler words, we should expect the two ETFs to move together and treat any deviation from that connection as an error by the market. When one ETF has meaningfully outperformed the other in the previous month, the one with weaker performance should be purchased. I tested that by running a correlation between the difference for each month and the difference reported in the next month. If my theory was correct, there should be a negative correlation. The test showed a negative correlation of 35.7% (rounded). With a decent sample size, I’m comfortable taking that as confirmation. In my opinion, the deviations in the market value of these two ETFs can be used as a clear indication on which ETF investors should be buying if they are investing with a time frame of a few years. If the time frame is multiple decades If investors are planning to buy and hold the shares for a few decades, the difference in expense ratios should overwhelm the regression between the two ETFs and I would expect VOO to provide slightly superior returns over the next 20 or 30 years due to the difference in expense ratios. Conclusion Vanguard S&P 500 ETF is a great investment for keeping up with the S&P 500 over the long time. It offers a lower expense ratio than SPY and very similar returns. When the time frame is measured in months or only a couple of years, investors may want to look at the recent difference in returns and choose the ETF that has seen weaker share price performance since there is a very solid history of the differences in performance reversing over the following month. For investors that can trade VOO without commissions, the benefit of removing commissions could eliminate the short term advantages of investing in the fund with a weaker short term history. However, that depends entirely on the share volume trading hands. If there was a meaningful movement in price between the two ETFs, I would expect the weaker one on average to capable of outperforming by about .10% in the following month. For the investor contemplating investing in VOO and capable of trading it without commissions, the most attractive time to do so is when it has just fallen short of SPY. If we assume SPY is the most accurate gauge of the movement in the economy, then any time that VOO becomes cheaper relative to SPY is a time when the ETF is more attractive to purchase. It doesn’t matter if SPY moved up or down last month, it simply matters whether VOO underperformed SPY. Disclosure: The author has no positions in any stocks mentioned, and no plans to initiate any positions within the next 72 hours. (More…) The author wrote this article themselves, and it expresses their own opinions. The author is not receiving compensation for it (other than from Seeking Alpha). The author has no business relationship with any company whose stock is mentioned in this article. Additional disclosure: Information in this article represents the opinion of the analyst. All statements are represented as opinions, rather than facts, and should not be construed as advice to buy or sell a security. Ratings of “outperform” and “underperform” reflect the analyst’s estimation of a divergence between the market value for a security and the price that would be appropriate given the potential for risks and returns relative to other securities. The analyst does not know your particular objectives for returns or constraints upon investing. All investors are encouraged to do their own research before making any investment decision. Information is regularly obtained from Yahoo Finance, Google Finance, and SEC Database. If Yahoo, Google, or the SEC database contained faulty or old information it could be incorporated into my analysis.

Do You Suffer From Investor ADHD?

Many investors are constantly seeking to maximize total return but this is a tactic, not a goal. If your portfolio suffers from being idea constrained, capital constrained, or diversity constrained, you might just have Investor ADHD. Avoid Investor ADHD in order to achieve better results. Do you suffer from Investor ADHD? If you read the news finance pages every day looking for companies in the news as investment ideas, you might just have Investor ADHD. If you constantly seek out a new ticker to invest in, you might just have Investor ADHD. If you buy a stock and then worry simply because it goes down the next day, you might just have Investor ADHD. If you are interested in 4 tickers and can’t decide which one to buy, you might just have Investor ADHD. If you constantly seek to always outperform the S&P500 (or any arbitrary metric stick), you might just have Investor ADHD. If you have more than 50 tickers in your portfolio, you might just have Investor ADHD. There is a lot of information out there in the financial world; staying focused and on plan is not always easy. Those who are able to shut out all the noise, the hustle and bustle, the hype, and the hum of the marketplace chatter will find that they succeed better and with more consistent results than the person who spends 4 hours a day reading and watching the latest financial news and reviewing 100 tickers. Warren Buffett quietly focuses on a simple strategy of finding companies he understands that are selling at a deep discount from their value. Jim Cramer is perhaps the poster boy for Investor ADHD. He is not just a sufferer, he’s a carrier! Don’t get me wrong, I love Cramer. He’s a great entertainer and provides tons of real information on every ticker he comments upon. He just doesn’t stay focused, and his results are scattered (and under perform) as a result. (click to enlarge) (image source: wordpress.com) Managing Investor ADHD: I think most of us have at least some Investor ADHD. We are news and information junkies. If not, we wouldn’t be Seeking Alpha readers. The key to managing Investor ADHD is discipline and planning. It is important not to confuse activity with progress. A plan lays out a goal and the pathway to reach it, along with the criteria to build that pathway. Time Management of Risk Risk is the number one impediment to achieving financial goals. Taking on excessive risk reduces the probability that you will reach your goal and increases the frequency of failure. At the same time, it is also important to realize that a failure to accept adequate risk can also doom a plan to failure. For example, if you need to double your money in 3 years (for some unfathomable reason), then you simply will have to take on large risk. The market place balances risk with returns, accompanying the potential for high rewards with higher risk and greater chance for failure also. Nonetheless, you cannot reach a goal without taking some risk. You can’t collect your prize on the other side of town if you don’t leave the safety of home and venture out upon the roads to get there. The key is to minimize the risk you must take on in order to achieve your end goal. This is why blindly pursuing highest total return is foolish. Highest total return potential requires highest total risk with it. Total return is an impressive metric to look back upon to know what historically has performed well. But it is a one-way filter; it demonstrates those who have reached today in spite of risk or by managing risk the best. It has filtered out those who tried but failed. This is why total return as a goal is far different than total return as a success metric, a subtle but important difference. To illustrate the point better, consider the 10 companies with the best performance of the past 20 years . These are mostly boring companies not seen in the daily news except rarely. Many are Tortoises , a few are rabbits. 1. Kansas City Southern (NYSE: KSU ) 19,030% 2. Middleby (NASDAQ: MIDD ) 14,330% 3. II-VI (NASDAQ: IIVI ) 10,423% 4. EMC Corp. (NYSE: EMC ) 9,624% 5. Qualcomm (NASDAQ: QCOM ) 9,232% 6. Oracle (NYSE: ORCL ) 8,571% 7. Diodes (NASDAQ: DIOD ) 8,601% 8. Biogen Idec (NASDAQ: BIIB ) 6,334% 9. Celgene (NASDAQ: CELG ) 6,244% 10. Astronics (NASDAQ: ATRO ) 6,004% Parts 1 and 2 of my Tortoise series review the historical results of how time is used to manage risk in investing. Statistics show that the longer horizon you remain invested over, the more consistent and reliable your returns will be. For the S&P 500 (NYSEARCA: SPY ), you have a 100% statistical probability of obtaining a 10% average annual rate of return on your S&P 500 portfolio if you remain invested at least 25 years. That falls to 82% chance if you only use a time horizon of 20 years and only a 55% expectation of meeting your 12% annual rate goal if you are invested for 3 years or less. On the other hand, if 8% returns are your goal, then a shorter horizon will get you there with 100% statistical certainty of achieving that goal. You will just need a time horizon of 15 years to be 100% confident of that goal. If you can accept a confidence level of 92% for achieving the 8% goal, a 10-year time horizon will suffice. (source: J.D. Roth, tinyurl.com/5p9fqf ) I strongly urge everyone to read and study J.D. Roth’s wonderful work ” How Much Does The Stock Market Actually Return “. It is a revealing piece on realistic expectations and how time is your most important investing tool if you use a diverse portfolio. Diversity to Manage Risk In addition to time as a risk management tool, diversity of holdings also helps manage risk . Generally speaking, a portfolio with a larger number of individual tickers (directly or via a mutual fund or EFT) will have less volatility and more reliable results than one with narrower holdings. The research, transaction costs, and available opportunities when trying to manage a portfolio of more than 50 individual tickers tends to become overwhelming. If you desire the diversity of more than 50 tickers, then it is probably best to focus on mutual funds and/or ETFs for all or a portion of your holdings. Avoid Being An ADHD Investor: These 8 habits will help you to avoid being an ADHD Investor: 1. First and foremost, set a clearly defined goal. Do you want to have $1 million, $5 million, $x million at the end of your “accumulation phase (generally start of retirement). 2. Consider your time horizon to reach that goal. Shorter time means smaller total returns and more risk. Time is your single greatest tool to manage risk. Start investing early! See part 1 and 2 of my Tortoise series for a discussion and statistics on this subject. seekingalpha.com/instablog/6618191-richa… 3. The second most important way to manage risk is through diversifying. If you do not have enough funds to own at least 20 equal weight tickers, then strongly consider using ETFs to provide diversity and minimize transaction costs. 4. Do not confuse activity for progress . Many investors like to compare their own results against the S&P500. That has some value as a total return metric, but *your* goal may not be total return. It may be capital preservation if you have accumulated or inherited $10 million. It may be safe and reliable dividend income, compound growth, or some other personal need such as “green investing” (oh pleeeeeeze tell me its not green investing!! hehe). 5. Always remember that almost all of us who write for Seeking Alpha are investors ourselves. Read between the lines. Watch out for agendas or pet companies, or a stated or unspoken objective that matches or departs from your own. Watch for what is not said in an reading an idea presentation. Spin can tell you a lot. Sometimes more than the actual information highlighted in a presentation. 6. Listen to and read the company conference calls. These are not just for analysts. They contain the most important information that you as an investor need to know. Keep in mind that “spin-factor” I mentioned in #5 above. Management is going to want to tell you what they want you to know, not what you need to know. For instance; “Results from consumer sales in the Midwest were held back by poor weather conditions which prevailed this past winter” is not just an excuse for low numbers, it is an admission that management is not managing weather risk by hedging for it using commodity or index hedges that are weather sensitive or by balancing with other business segments that benefit for weather that negatively impacts other segments. Thus, a simple phrase like “poor weather conditions” can tell you a lot about management and whether they are sharp enough to control the company’s destiny or at leave themselves (and you, the investor) at the whim of nature and other outside influences. 7. Following up on #6 above, seek out excellent management that has a firm grip on the reigns of destiny and guides the company though all conditions with a firm hand. These are the going to be the true champions for the long journey. 8. Read and embrace analysis that presents both good and bad sides of investments you are considering. No company is perfect. Understanding the strength and the weakness of a company will give you the edge in assessing what to watch for going forward to make it more successful or hold it back. This is true for both internal factors and the macro environment. If you know the 5 key things your company investment is sensitive to and will cause market moves in its shares, then you will know when to buy and when to sell. You will also be able to know in advance when these buy and sell points are nearing based on the gathering portents you will know to watch for. Closing Thoughts: When your brain starts screaming information overload, sit back and focus on a calming influence. Take the time to take a break. For me, I look out my window and see this view… (click to enlarge) (image source: photo by author) Developing and following these habits allowed me to create the opportunity to own my home with this view. Continuing to practice them allows me to enjoy it. I hope you all will create a dream, pursue it, and achieve it. I hope I am able to help you to do that with what I write based on my life experiences along the continuing journey. Richard Become an instant alert follower to be sure to get notice of all my latest analysis and income yield boost articles as they are released. You can follow this link to my other articles , most of which include covered option strategies. If you wish to receive notices of my future articles (or real time alerts as they publish), simply hover your cursor over the “FOLLOW” to the right of my picture at the top of this article or select the options in the author box shown below at the end of this article. I am not a licensed securities dealer or advisor. The views here are solely my own and should not be considered or used for investment advice. As always, individuals should determine the suitability for their own situation and perform their own due diligence before making any investment. Disclosure: The author has no positions in any stocks mentioned, and no plans to initiate any positions within the next 72 hours. (More…) The author wrote this article themselves, and it expresses their own opinions. The author is not receiving compensation for it (other than from Seeking Alpha). The author has no business relationship with any company whose stock is mentioned in this article.

Got DIA? Got DJIA Stocks? Which Is Better?

Summary Very few Exchange-Traded Funds get analyzed in detail, down at the individual holdings level. The DIA lends itself to that by its few, prominent components. The diverse nature of the 30 stocks in the DJIA Index, by design, raises the question of how to rate a CAT in comparison to a PG or a MSFT. And who’s doing the rating? What’s their bias? How do they define risk, and how is that balanced against reward? We get the Market-Making [MM] community to tell us daily, how far up and down the prices of the 30 stocks, and the DIA ETF, are likely to go next. Not voluntarily. But MM capital is regularly put at risk, protected by hedging transactions, helping big-$ funds adjust their portfolio holdings. The hedges’ cost and structure provide price range forecasts. Market-Makers never saw a profit they didn’t like or a risk they did Their principal customers, big-money institutional investment funds, work hard constantly, trying to stay employed at sweet-salary jobs by getting the capital in their charge to perform competitively. That takes shuffling around a lot of “chips” on their “poker table”. The size of their bets often stretches the capacity of markets’ ordinary way, every-day trading. To try to get their volume trade orders of 10,000 shares or sometimes millions of shares “filled” without chasing the issue’s price away from what they want to get, they often use trusted investment bank block-trade services. The kinds of stocks in the DJIA Index are just the ones most likely to see this sort of activity, which often dominates their price movement. The block trade house “makes the market” some 95% of the time by putting its own capital at risk temporarily, positioning that stub end of the “other side of the trade” that the other players in the Street will not accommodate right now, at the desired price. But the MM’s risk is always hedged by side bets in derivative securities – at a cost. Because of the cost, such protection is rarely overbought, because the fund originating the block order has to absorb the cost in the single price per share for the entire transaction. When the cost is too high, the fund balks, and the trade proposition is killed, along with its juicy (to the MM) transaction spread. So all the motivations are there to keep that game honest since the sellers of the price change protection insurance are often the proprietary trading desks of other MM firms. They are as equally well-informed on the future prospects of the subject as the house handling the block trade. And the competitive nature of the community is reminiscent of the seagull dock scene in the film “Finding Nemo”. Mine! Mine! Our Behavioral Analysis of the intelligent actions of the market professionals produces for each subject a price range MMs consider worth protecting against, either as a buyer or a seller of the protection. The change from current market quote to the upper end of the range is a forecast of possible, even likely, price gain, or reward. The opposite direction is a forecast of the kind of price drawdown risk that could be encountered. That risk may not have to be accepted and recognized as a loss, if in time the price rises. But the period the investment is “under water” is an emotionally disturbing condition, one that often leads investors to loss-taking to prevent the present from getting worse. Sometimes their fears are justified, and worst-case price drawdowns increase the emotional stress to the breaking point where investors accept what appears to be “inevitable”, but could have been avoided. Knowing what the worst has been and the odds of recovery to a profitable position from there minimizes that mistake. We have an established, Time-Efficient Risk Management Discipline [TERMD] procedure of portfolio management that enables us to evaluate the odds of a subject investment’s recovery from a price drawdown, back to a profitable transaction experience. That procedure, applied to all prior forecasts with upside to downside forecast proportions, usually gives a history from hundreds of actual market experiences. Figure 1 is a reward-to-risk map of the 30 DJIA stocks showing their current hedging-derived upside forecasts (on the green horizontal scale) and their worst-case price drawdowns (on the red vertical scale) following prior forecasts like today’s. Figure 1 (used with permission) The advantage of diversification is apparent in DIA [4], with worst-case price drawdowns no worse than all but one of the 30 stocks – at today’s market quotes and upside forecasts. The cost of that diversification is also apparent in the DIA’s upside prospect now being about +3%, compared to the average of the individual stocks of some +5% higher, around +8%. To get the odds for price recovery and a profitable transaction from today’s market prices, we need to check out column (8) of figure 2, today’s appraisals by MMs for the 30 stocks. Figure 2 (click to enlarge) Whoa! There’s a mess of numbers here. The MMs’ price range forecasts for the 30 stocks are in the first two data columns of Figure 2, followed by their separate forecasts for the SPDR Dow Jones Industrial Average ETF (NYSEARCA: DIA ), and as an additional market average index, the SPDR S&P 500 Trust ETF (NYSEARCA: SPY ). The upside percent price change potential is in (5), and the worst-case prior price drawdowns are in (6). These are the coordinates used in Figure 1. The odds of a price recovery from worst-case price drawdowns are in column (8). For example, down at the bottom of the table are DIA and SPY, which have histories of 111 days and 215 days out of the last 5 years, 1,261 market days, in which 84 or 83 out of every 100 produced a profitable transaction using our standard TERMD portfolio management discipline. That is about 5 out of every 6 trades. The average gain by DIA (column 9) from all 111 such positions was only +1.9%. That compares to Disney (NYSE: DIS ) up near the top of figure 2, with a similar 84/100 odds, but it has an achieved gain of twice that of DIA at +3.8%. Further, it took (column 10) only 29 market days – 6 weeks – to reach its sell targets or 3-month holding time limits while DIA took 35 days, or 7 weeks. For the investor most concerned with safety of principal and averse to investing choices, the difference is trivial, inconsequential. But for the investor attempting to build wealth, the compounding of 3.8% gains more than 8 ½ times a year, compared to 1.9% compounded 7 times makes the difference in investment growth of +38% a year vs. +14% (column 11). We have ranked the 30 stocks held in DIA by their forecast price growth per day held (in prior like forecasts) weighted by their prior odds of profit, net of worst-case losses weighted by their odds of loss, with some other minor adjustments, to get an odds-weighted (reward vs. risk) figure of merit for each of these stocks in (15). It is a useful means of setting preferences between investment alternatives for investors concerned with growing their investment wealth. For those concerned with safety or income, it is far less useful. Comparing (15) data for the top ten such ranked DJIA stocks in the upper blue row so labeled, with the next blue row, averaging all 30, shows that at current market prices the top ten are 9 times (14.8 vs. 1.6) as beneficial to the DIA as the other two-thirds of the holdings. Comparing DIA to SPY finds the broader market average is more than twice as strong by this measure, (6.3 vs. 2.7). That may be a suggestion that the DJIA Index is now higher priced temporarily than the S&P 500. Other comparisons, not shown, lead to the same conclusion. The more interesting comparisons are between the average of nearly 2,500 stocks and ETFs, and the market indexes, DIA and SPY. Upside price change forecasts are twice as large for the population as for SPY and 3+ times as large as for DIA. But history shows them to be far riskier (6) at -9.4% price drawdowns than either ETF. That difference, plus far lower odds of capturing a profit (66 out of 100 in column 8), combine to create a net negative figure of merit in (15). Both ETFs provide the security of positive measures. Conclusion DIA at its current market quote offers investing prospects far less attractive than the principal market-average-tracking alternative SPY. An examination of the DIA holdings individually puts over a third of them in the category of a negative influence on the DJIA Index, and thus on DIA. While the ETFs S&P and DIA do provide safety from large price drawdowns encountered by individual stocks, they may give that reward at a high cost to future wealth growth from selective use of specific index holdings. Disclosure: The author has no positions in any stocks mentioned, and no plans to initiate any positions within the next 72 hours. (More…) The author wrote this article themselves, and it expresses their own opinions. The author is not receiving compensation for it (other than from Seeking Alpha). The author has no business relationship with any company whose stock is mentioned in this article.