Tag Archives: nysearcaspy

Selling At The Best And Worst Possible Times

In a previous article, I expanded on Peter Lynch’s “high and low analysis.” That view looked at potential returns had you bought at the high and low price each and every year. This commentary takes the opposite view: seeing what happens if you sold at the high and low price each and every year. In a previous article , I expanded upon Peter Lynch’s “high and low” analysis. This involves looking at what would have happened if you invested at the very best and worst times (the high and low price, respectively) each and every year. The process was simple, but the takeaway is enormously instructive: “Investing at the high or low, especially over the long term, is not the difference between positive and negative returns. The difference between perfect timing and miserable timing over lengthy time periods is perhaps a couple of percent. Once you figure this out, it becomes clear that you should be focusing on the amount you can contribute and utilizing a long time frame, rather than concerning yourself with unknowable short-term fluctuations.” In Lynch’s example, the difference between perfect yearly purchases and dreadful annual timing was about 1% per annum. In my example, the difference was slightly larger, but the basic conclusion remained intact: “it’s not about timing the market, it’s about time in the market.” These demonstrations were based on the purchase side: “what happens if I bought each and every year?” For this article, I wanted to focus on the selling side. To make the process simple, we can rely on the same high and low price information as generated by the SPDR S&P 500 Trust ETF (NYSEARCA: SPY ). Here’s a look at the low price from each year dating back to 1996: Year Low Date Price 1996 1/10/96 $59.97 1997 4/11/97 $73.38 1998 1/9/98 $92.31 1999 1/14/99 $121.22 2000 12/20/00 $126.25 2001 9/21/01 $97.28 2002 10/9/02 $78.10 2003 3/11/03 $80.52 2004 8/6/04 $106.85 2005 4/20/05 $113.80 2006 6/13/06 $122.55 2007 3/5/07 $137.35 2008 11/20/08 $75.45 2009 3/9/09 $68.11 2010 7/2/10 $102.20 2011 10/3/11 $109.93 2012 1/3/12 $127.50 2013 1/3/13 $145.73 2014 2/3/14 $174.17 Additionally, we have the high price available as well from the same article: Year High Date Price 1996 11/25/96 $76.13 1997 12/5/97 $98.94 1998 12/29/98 $124.31 1999 12/29/99 $146.81 2000 3/24/00 $153.56 2001 2/1/01 $137.93 2002 1/4/02 $117.62 2003 12/31/03 $111.28 2004 12/29/04 $121.36 2005 12/14/05 $127.81 2006 12/14/06 $143.12 2007 10/9/07 $156.48 2008 1/2/08 $144.93 2009 12/28/09 $112.72 2010 12/29/10 $125.92 2011 4/29/11 $136.43 2012 9/14/12 $147.24 2013 12/31/13 $184.69 2014 12/29/14 $208.72 Let’s imagine that you want to supplement your dividend income , such that you take all of the dividends and also begin selling some shares along the way. Now, assuredly it is the goal of a great deal of people to never have to sell a share. However, that doesn’t mean that everyone must follow this route. Nor does it mean that we can’t think about the process. For illustration, let’s imagine that you have a portfolio balance of $1,000,000 back in 1996 (the number isn’t important, just the underlying math). Your idea is to buy shares in an assortment of holdings (in this case an index fund), collect the dividend payments and supplement this by selling an amount of shares each year. Let’s imagine that you want to sell $25,000 worth of shares beginning in 1997, followed by a 2% larger amount in the subsequent years. Here’s what your sold shares would need to amount to through the years: Year Sold Shares 1997 $25,000 1998 $25,500 1999 $26,010 2000 $26,530 2001 $27,061 2002 $27,602 2003 $28,154 2004 $28,717 2005 $29,291 2006 $29,877 2007 $30,475 2008 $31,084 2009 $31,706 2010 $32,340 2011 $32,987 2012 $33,647 2013 $34,320 2014 $35,006 Note that I’m taking a bit of a shortcut here. In reality, instead of focusing solely on the amount of shares you want to sell each year, you’d like to focus both on dividends received and the amount of shares needed to sell in a given year depending on your income requirement. However, with the high and low prices varying dramatically in dates, it’s a rather manual process to figure out the dividends received. It’s not uniform such that sometimes you have more than a year between the high or low price in two consecutive years and sometimes the time frame is just a few months. However, for our purposes, the illustration of selling a certain dollar amount of shares each year will work nicely. Let’s begin by seeing what happens in a “best case” scenario. The low price in 1996 was just under $60 per share. If you bought at this time, you would have been able to purchase 16,675 total shares. Additionally, your expected annual dividend income would have been about $21,000. We can now move on to the process of selling. In 1996, you were able to purchase shares at the best possible time. Let’s presume that you’re also able to sell shares at the best possible time – the highest price of every single year. In 1997, the highest share price was just under $99. In order to generate $25,000 in additional income, you would need to sell roughly 253 shares. As a result, your share count would go down to 16,422 or thereabouts. And so the process continues; in 1998, the highest share price was just over $124. In order to generate $25,500 in supplemental income, you would need to sell 205 shares, bringing your total share count down to 16,217. Here’s a look at your year-end share count from 1996 through 2014 if you kept selling at the high each year: Year Shares 1996 16,675 1997 16,422 1998 16,217 1999 16,040 2000 15,867 2001 15,671 2002 15,436 2003 15,183 2004 14,947 2005 14,718 2006 14,509 2007 14,314 2008 14,100 2009 13,818 2010 13,561 2011 13,320 2012 13,091 2013 12,905 2014 12,738 At first glance, this looks like pretty bad news. You started with 16,675 shares, and nearly two decades later, you’ve sold almost 4,000 shares, bringing your total share count down to “just” 12,700. Yet, it’s important to remain cognizant of what this indicates. Your share count has been reduced, that much is obvious. What’s not as apparent is the idea that you would actually be getting richer over time. Your $1 million beginning portfolio balance would now be worth nearly $2.7 million. Further, in the last 12 months, this amount of shares still would have generated $50,000 worth of dividend payments. Contrary to what many suppose, selling shares doesn’t have to be an exhaustive process to zero. I’m not necessarily personally advocating for this method, but it’s instructive to know that this option exists nonetheless. In this particular case, you would have collected hundreds of thousands in dividends, sold over half a million in shares through the years and still ended up much richer. Of course, this was also a best-case scenario – buying at the low and selling at the high every single year. Let’s take a look at the “worst case”: buying at the high and selling at the low every single year. In 1996, shares of the index traded as high as $76. Had you purchased shares at this price, you would have begun with 13,135 total shares – noticeably lower than the “best” case of buying at the low. Additionally, your expected annual dividend income would be about $17,000. (We could adjust for this in the example, but the illustration is the important part). In 1997, the low share price reached about $73. In turn, in order to reach your $25,000 supplemental income goal, you would need to sell about 341 shares. This would bring your total share count down to fewer than 12,800 (basically where the other example ended). Wash, rinse, and repeat. Here’s a look at your year-end share count each year after selling shares to reach your additional income goals: Year Shares 1996 13,135 1997 12,795 1998 12,518 1999 12,304 2000 12,094 2001 11,816 2002 11,462 2003 11,113 2004 10,844 2005 10,586 2006 10,343 2007 10,121 2008 9,709 2009 9,243 2010 8,927 2011 8,627 2012 8,363 2013 8,127 2014 7,926 Once more it’s obvious that your share count will be reduced each and every year. Moreover, it’s also apparent that this situation is markedly worse than the “best case” scenario. Yet, the output provided here is perhaps even more instructive. You began with a $1 million balance that was purchased at the worst possible price point. Then you went on to make sale after sale at the worst possible time each and every year. However, those 7,900 shares would now be worth almost $1.7 million. Further, over the last 12 months, these shares would have provided over $31,000 in dividend income. Expressed differently, even if you bought and sold at the worst possible moments, you would still get richer over time (with a larger cash flow to boot). The reason this works is due to “selling in moderation.” Obviously, you can’t go out and sell 15% of your portfolio each and every year and expect to end up with a higher portfolio balance over time. However, when done purposefully, selling shares and getting richer do not have to be opposite notions. The thing of it all is that you’re not going to complete either exercise. You’re not going to have perfect timing and you’re not going to have the worst possible timing year-in and year-out. Mathematically it just won’t occur. Yet, even if you did, at least in this illustration, it has been no great tragedy. Regardless of the situation you still ended up with a higher balance. Much like the previous example of consistently buying, it seems that having an underlying plan – rather than figuring out the “best” timing – is a much more important factor. Disclosure: I/we have no positions in any stocks mentioned, and no plans to initiate any positions within the next 72 hours. (More…) I wrote this article myself, and it expresses my own opinions. I am not receiving compensation for it (other than from Seeking Alpha). I have no business relationship with any company whose stock is mentioned in this article.
The Risk Of Owning Stock Assets And Holding Stock Assets Right Now

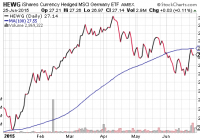
Hold-n-hope advocates believe that greater gains with stocks over investment grade bonds require nothing more than a commitment to accepting increased volatility. At least during the bulk of the current century, one’s willingness to endure wacky stock price changes did not lead to enhanced results. Risk is not synonymous with price volatility, even though erratic price shifts do lead to a greater likelihood of losing money. Hold-n-hope advocates believe that greater gains with stocks over investment grade bonds require nothing more than a commitment to accepting increased volatility. In other words, if you accept the occasional craziness of stock prices, then your rewards will be far more robust than lower yielding debt instruments. But is that even accurate? In the 15-year period through 5/31/2015, stocks exhibited 4 times the amount of price vacillation (a.k.a. volatility) than bonds. Yet the S&P 500 SPDR Trust ETF (NYSEARCA: SPY ) provided annualized gains of 4.5% and the iShares Core Total U.S. Bond Market ETF (NYSEARCA: AGG ) produced annualized returns of 5.4% in the same time frame. At least during the bulk of the current century, one’s willingness to endure wacky stock price changes did not lead to enhanced results. The facts become even more revealing when one examines them in dollar terms. An investor who placed $250,000 in SPY on 6/1/2000 found the investment growing to $483,000 by 5/31/2015. He did not sleep particularly well during the dot-com bust, financial collapse or the euro-zone crisis, but he made progress with his account. Meanwhile, an investor who placed $250,000 in AGG on 6/1/2000 witnessed her investment growing to $550,000 by 5/31/2015. Her world never felt like it was coming to an end; she slept like a beloved house cat on a warm blanket. Risk represents the possibility of loss. Risk is not synonymous with price volatility, even though erratic price shifts do lead to a greater likelihood of losing money. It follows that many trumpet the idea that if you hold stocks long enough, you cannot lose money, let alone lose out to bond assets. Keep in mind, however, there are circumstances when stocks have struggled to break even over 65 years, 30 years as well as 15 years . Additionally, there are no guarantees that one will achieve a positive inflation-adjusted outcome over any time period. On the contrary. History suggests that when one pays an inordinate amount for the privilege of stock ownership, he/she would be fortunate to be “made whole” over 3, 5, 7 and 10 year periods. By nearly every measure of stock valuation, investors are already paying an inordinate amount for stocks. This alone implies that one might be setting himself/herself up for poor returns over the short- and intermediate-term. Let’s revisit the mistake that scores of investors made in June of 2000. They purchased stocks when price-to-earnings (P/E) and price-to-sales (P/S) ratios were higher than they had ever been beforehand. The result? An exceptionally rocky ride that produced little in the way of gain, and that’s if one had the fortitude to hold through thin and thick. Today, the P/E and P/S ratios for the median U.S. stock are higher than they were in June of 2000. So, then, what’s the probable result for buy-n-holders over the next 3, 5, 7 and 10 years? Even 15 years may be discouraging for those who pay today’s premium for ownership privileges. Granted, today’s 10-year yield is 2.38%. In June of 2000? 5.28%. The likelihood that bonds will outperform stocks over the next 15 years may be pretty darn slim. Over 10 years, however? With less risk of loss? Less volatility? In a buy-n-holder’s world, 2.4% on the 10-year may not be so ugly. My approach to the risks associated with owning and holding stocks at the current moment is to maintain cash/cash equivalents at 15%-20% for most of my client base. How did we move from roughly 70% growth/30% income to roughly 55%-60% growth/20%-25% income and a basket with cash/cash equivalents? Throughout the year, I reduced exposure to intermediate- and longer-term bonds; I had reduced the exposure to stock ETFs as well – stock ETFs like iShares Currency Hedged Germany (NYSEARCA: HEWG ) that had hit stop-limit loss orders and/or fallen below key trendlines. I will keep the 55%-60% growth allocation in funds like the Vanguard High Dividend Yield ETF (NYSEARCA: VYM ), the iShares S&P 100 ETF (NYSEARCA: OEF ) and the Health Care Select Sect SPDR ETF (NYSEARCA: XLV ), until those assets break below long-term moving averages or hit pre-determined stop-limit losses. And when cash is raised, the proceeds will be moved to money markets or shorter-term vehicles like the S PDR Nuveen Barclays Short-Term Municipal Bond ETF (NYSEARCA: SHM ). Why the combination of lower-risk equity positions, lower-risk bond positions and a higher cash allocation? Later or sooner, profitability and revenue shortfalls will weigh on equities. Later or sooner, borrowing cost increases will weigh on bonds and stocks. Most importantly, the best way to deal with sky-high valuations as well as the increased cost of capital is to keep more of the dollars that you already have. Is preservation sexy? No. Might it seem like a silly proposition over the next three months, six months, or one year? Perhaps. Looked at another way, though, selling overvalued assets higher offers one the opportunity to purchase fairly valued or undervalued assets lower. With current prospects for stock percentage returns sitting at 0% for three, five, seven and even 10 years, successful investors will prevail by making acquisitions after the proverbial fall. Disclosure: Gary Gordon, MS, CFP is the president of Pacific Park Financial, Inc., a Registered Investment Adviser with the SEC. Gary Gordon, Pacific Park Financial, Inc, and/or its clients may hold positions in the ETFs, mutual funds, and/or any investment asset mentioned above. The commentary does not constitute individualized investment advice. The opinions offered herein are not personalized recommendations to buy, sell or hold securities. At times, issuers of exchange-traded products compensate Pacific Park Financial, Inc. or its subsidiaries for advertising at the ETF Expert web site. ETF Expert content is created independently of any advertising relationships.

Predicting The Future Is Difficult

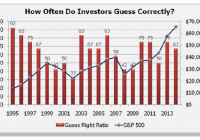
Neils Bohr, a Nobel prize-winning Danish physicist who made foundational contributions to the understanding of atomic structure and quantum theory, is credited to have once said: “Prediction is very difficult, especially if it’s about the future.” While it sounds more like a ” Yogi-ism ,” the point made is interesting particularly as it relates to investing. I was reminded of this quote by a comment made on a recent post entitled “Bullish Or Bearish, What The Charts Say.” As I stated in that post: “I really don’t care much for the “bull/bear” debate that ensues on a daily basis as both camps are eventually wrong. When investing in the markets ‘it is, what it is’ and it is of very little use that some pundit or analyst was ‘right’ during the bull market if they never saw the bear market coming. The opposite is also true.” Predictions of the future are indeed very difficult, and yet individuals are challenged every day with doing precisely that. For traders, it is what the market, or a particular investment, will do in the next few minutes to days. For longer-term investors, those predictions move out to months or years. The problem is that humans generally suck at predicting the future, particularly when it comes to investing. This is clearly shown in Dalbar’s 2015 investor study in what they term the ” Guess Right Ratio .” To wit: “DALBAR continues to analyze the investor’s market timing successes and failures through their purchases and sales. This form of analysis, known as the Guess Right Ratio , examines fund inflows and outflows to determine how often investors correctly anticipate the direction of the market. Investors guess right when a net inflow is followed by a market gain, or a net outflow is followed by a decline. Unfortunately for the average mutual fund investor, they gained nothing from their prognostications. ” (click to enlarge) The inability of investors to correctly predict the future has had serious consequences for their portfolio both in the short and long term as shown by the two tables below. (click to enlarge) (click to enlarge) The massive underperformance over a 30-year span shows that investors, despite the best of intentions of being ” long term ” are saddled not only by poor predictions of the future, but also the ” emotional biases ” that drive accumulations and liquidations at the most inopportune times more commonly known as the “buy high/sell low” syndrome. Currently, it is ” predicted ” that the market will only rise from current levels as witnessed by a recent report from Brian Wesbury at First Trust: “Using a 4% 10-year discount rate gives us a ‘fair value’ calculation of 2,550 and it would take a 10-year yield north of 4.8% and no growth in corporate profits in Q2 for the model to suggest equities are fully valued.. .investors should be more tilted toward equities than they would normally be and we believe those that are should continue to enjoy attractive returns over at least the next couple of years. This bull has further to run .” However, Brian, like all humans, including me, are horrible predictors of future outcomes. As an example, this is what Brian predicted in July 2007 just before the largest financial crash since the ” Great Depression :” “The bottom line is that fears about the underlying health of the economy and financial markets are more about hypochondria than reality. The Fed is not tight, just less loose, the economy is strong, tax rates are low, and corporate earnings remain robust. Let’s not confuse indigestion and heartburn with the ‘big one. ‘” Or this in February of 2008 as the recession was in full swing: “None of this is an attempt to say that a recession is impossible. Recessions are always possible. But neither the policy pre-conditions, nor the data, suggest we are anywhere near a recession today. Current fears of a recession are premature .” Of course, it did turn out to be the “big one.” However, Brian, like all economists and analysts are using data to make future predictions that are highly subject to revisions in the future. This is the equivalent of trying to shoot a moving target while blindfolded riding a merry-go-round. While I am sure there is some trick shot artist that could nail such a feat on “America’s Got Talent,” for the mere mortal the odds of success are extremely low. The same problem that exists for individuals, also applies to ” professionals .” There are but a handful of investment managers that have consistently outperformed the ” market ” over long periods of time. But even that comment is a bit misleading as relative outperformance is of little consolation to investors when the market is down 30%, and the portfolio is down 29%. Did the manager outperform? Yes. Did the investor stick around? Probably not. But it is precisely this conversation that leads to a litany of articles promoting ” buy and hold ” investing. While ” buy and hold ” investing will indeed work over extremely long periods, investor success is primarily a function of time frames and valuation at the beginning of the period. Considering that most investors have about a 20-year time horizon until they reach retirement, the “when” becomes a critical component of future success. (click to enlarge) Of course, ” buy and hold ” commentary is mostly seen near fully mature “bull markets” as the previous bear market fades into distant memory. Eventually, despite the best of intentions, the markets will complete their full-market cycle and investors will head for the exits perpetuating the ” buy high/sell low ” syndrome. It is here that we find the VERY BEST predictor of future outcomes – past behavior. Psychology Today had a very interesting piece on this particular issue as it relates to violent crimes. But when it comes to investing, most individuals fit the requirements necessary to fulfill how they will behave in the future. Habitual behavior – (buy high/sell low) Short time intervals – (months or years, not decades) Anticipated situation aligns with the past situation that activated behavior. (bull vs. bear market) Behavior not extinguished by negative impact. (loss not great enough to deter future action) Person remains essentially unchanged. (speculator vs. saver) Person is fairly consistent (willingness to accept risk/avoid loss) Certainly, past behavior may not accurately predict the future behavior of a single individual. However, when it comes to the financial markets which is representative of the ” herd mentality ,” past behaviors are likely good indicators of future outcomes. Despite an ongoing litany of bullishly biased reports as markets push towards new highs, it should be remembered that markets only attain new highs about 5% of the time historically speaking. The other 95% of the time is recouping previous losses. (click to enlarge) Does this mean that you should sell everything and go to “cash?” Of course not. However, it does mean that as an investor you should critically analyze your past personal behavior during market advances AND declines. If you are like MOST investors , it is likely that you did exactly the opposite of what you should have. If that is the case, does it not make some sense to begin thinking about doing something different?