Tag Archives: nysearcaspy

5 Ways To Beat The Market: Part 4 Revisited

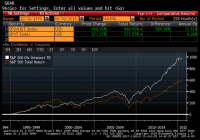
Summary •In a series of articles in December 2014, I highlighted five buy-and-hold strategies that have historically outperformed the S&P 500 (SPY). •Stock ownership by U.S. households is low and falling even as the barriers to entering the market have been greatly reduced. •Investors should understand simple and easy to implement strategies that have been shown to outperform the market over long time intervals. •The fourth of five strategies I will revisit in this series of articles is consistent dividend growth investing which has seen these stocks produce higher risk-adjusted returns over time. In a series of articles in December 2014, I demonstrated five buy-and-hold strategies – size, value, low volatility, dividend growth, and equal weighting, that have historically outperformed the S&P 500 (NYSEARCA: SPY ). I covered an update to the size factor published on Wednesday, posted an update to the value factor on Thursday, and published an update on the low volatility anomlay on Friday. In that series, I demonstrated that while technological barriers and costs to market access have been falling, the number of households that own stocks in non-retirement accounts has been falling as well. Less that 14% of U.S. households directly own stocks, which is less than half of the amount of households that own dogs or cats , and less than half of the proportion of households that own guns . The percentage of households that directly own stocks is even less than the percentage of households that have Netflix or Hulu . The strategies I discussed in this series are low cost ways of getting broadly diversified domestic equity exposure with factor tilts that have generated long-run structural alpha. I want to keep these investor topics in front of the Seeking Alpha readership, so I will re-visit these principles with a discussion of the first half 2015 returns of these strategies in a series of five articles over five business days. Reprisals of these articles will allow me to continually update the long-run returns of these strategies for the readership. Dividend Aristocrats While people can complicate investing in a myriad of ways, only two characteristics ultimately matter – risk and return. My personal and professional investing revolves around the simple maxim of trying to earn incremental returns for the same or less risk. The strategy highlighted below has accomplished this feat over long time horizons, and is easily replicable in financial markets. In addition to the bellwether S&P 500, Standard and Poor’s produces the S&P 500 Dividend Aristocrats Index . (Please see linked microsite for more information.) This index, which is replicated by the ProShares S&P 500 Dividend Aristocrats ETF (NYSEARCA: NOBL ), measures the performance of equal weighted holdings of S&P 500 constituents that have followed a policy of increasing dividends every year for at least 25 consecutive years. To put this into perspective, the average S&P 500 constituent now stays in the index for an average of only eighteen years , so the list of companies who have had the discipline and financial wherewithal to pay increasing dividends for an even longer period is necessarily short at 52 companies (10.4% of the index). Detailed below is a twenty-year return history for this index relative to the S&P 500. The Dividend Aristocrats have produced higher average annual returns, outperforming the S&P 500 by 2.4% per year. This approach has also produced returns with roughly three-quarters of the risk of the market, as measured by the standard deviation of annual returns as demonstrated in the cumulative return profile graph and annual return series detailed below: (click to enlarge) (click to enlarge) Source: Standard and Poor’s’ Bloomberg Notably, the Dividend Aristocrats outperformed the S&P 500 in every down year for the latter index (see shading above), gleaning part of its outperformance through lower drawdowns in weak market environments. Another notable factor of the dividend strategy is that when it underperformed the S&P 500 by the largest differential (1998, 1999, and 2007) the market was headed towards large overall losses. Maybe then it is a negative sign that the underperformance of the Dividend Aristocrats in the first half of 2015 was its largest since the 2007 top. The Dividend Aristocrats posted their first negative return for a half-year since 2010. Perhaps, this correlation between Dividend Aristocrat underperformance and market tops is spurious and not a leading indicator, but it makes sense that prior to the tech bubble burst in the early 2000s that the Dividend Aristocrats naturally featured less recent start-ups because of the long performance requirements for inclusion. It also makes sense that when markets were heading to new all-time highs in 2007, the market correction in 2008 would be less severe for the high quality constituents in the Dividend Aristocrats index, which have demonstrated the ability to manage through multiple business cycles. I have now dedicated several paragraphs to dividend growth investing in companies with a policy to offer consistent and growing dividends without addressing the elephant in the room. Do dividends matter?! Certainly academics have long contested that dividends should not matter to the value of the firm, and can even be inefficient given shareholder taxation. Absent taxes, investors should be indifferent between a share buyback and a dividend, which are different forms of the same transaction – returning cash to shareholders. Paying dividends when the firm has projects that can earn a return above their cost of capital would lower the value of the firm over time. Merton Miller, Nobel Prize winner and one of the fathers of capital structure theorem, tackled the debate in a 1982 paper entitled ” Do Dividends Really Matter .” My takeaway from his qualitative analysis is that paying consistently rising dividends is a discipline that ensures that the company is appropriately levered and making well planned investment decisions. In Friday’s update article on exploiting the Low Volatility Anomaly , I demonstrated that lower risk stocks have outperformed the broader market and higher risk stocks over the last twenty plus years in markets around the world. The business model of Dividend Aristocrats must be inherently stable and produce continual free cash flow through the business cycle or these companies would not be able to maintain their record of paying increasing dividends for over a quarter century. The return profile of the Dividend Aristocrats is much more correlated to the S&P Low Volatility Index ( SPLV , r= 0.92) than the S&P 500 (r = 0.84 ), which lends credence to the strategy’s low volatility nature and stability through differing market environments. I have chosen to detail the Dividend Aristocrats and Low Volatility stocks separately because I believe part of the strong performance of the Dividend Aristocrats is also attributable to the fifth factor tilt highlighted in my concluding article in this series update to be published tomorrow. Disclaimer: My articles may contain statements and projections that are forward-looking in nature, and therefore inherently subject to numerous risks, uncertainties and assumptions. While my articles focus on generating long-term risk-adjusted returns, investment decisions necessarily involve the risk of loss of principal. Individual investor circumstances vary significantly, and information gleaned from my articles should be applied to your own unique investment situation, objectives, risk tolerance, and investment horizon. Disclosure: I am/we are long NOBL, SPLV, SPY. (More…) I wrote this article myself, and it expresses my own opinions. I am not receiving compensation for it (other than from Seeking Alpha). I have no business relationship with any company whose stock is mentioned in this article.
China ETFs – How Cheap Is Cheap?

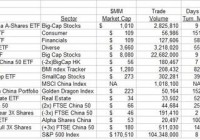
Summary What do we know about China and its securities? Only that in the past weeks those have given up in price virtually all they achieved in the 2015 second quarter. So we’re back to where major Chinese stock indexes were in mid-March. Only ahead of a year ago by +20%. Tsk, tsk. Somewhat better than SPY. Since we don’t know much, we ask market-maker folks [MMs] who earn a very enviable living making bets about what can happen to those stocks. What do they think? Well, they don’t want us interfering as they help big-money fund clients move their portfolios’ million-dollar trade positions around, by putting the MM firm’s capital at risk. But as market-makers hedge those risks, they can’t help but tell us by their actions how big they think the risk prospects are – in both directions, down and up. The Risk~Reward Tradeoff Lives in Asia Too Some 15 ETFs focused on China find enough active trading among major big-money investment management organizations to create a continuing interest that can be tracked. Here is how their typical trading compares with that of our market-proxy tracker, the SPDR S&P 500 Trust ETF (NYSEARCA: SPY ): Figure 1 (click to enlarge) Figure 2 provides a comparison of how U.S.-based market-makers’ hedging forecasts upside prospects for these ETFs as of the Thursday 7/9/15 close, with the worst-case price drawdowns they have faced following forecasts similar to todays’. Figure 2 (used with permission) In this mapping upside price change prospects are scaled on the green horizontal and actual prior maximum price drawdowns following similar forecasts are on the red vertical scale. The dotted diagonal shows where the two conditions are equal. As a markets comparison SPY is at location [13]. Most China ETFs are either higher downside price risk or lower return, or both. The standout value of the moment appears to be the iShares China Large-Cap ETF (NYSEARCA: FXI ) at [7]. Further details on this and the other pictured ETFs are in the table of Figure 3. Figure 3 (click to enlarge) Of quick comparative interest should be the blue row summaries of Figure 3, comparing the present average MM perceptions of China ETFs with current-day data of U.S. and world equities. The 16 Chinese ETFs Offer larger upside forecasts (column 5) with nearly the same -6% average risk exposures (7). But their net gains achieved (9) from similar prior forecasts at +5% have been only half the size (+10.3%) of the 20 best of the 2584 population of measurable equities. Part of the difference comes from better recovery from price drawdowns back to profitable prices (8) of 86 out of each 100 for the 20, while the Chinese 16 were able to recover only 73 of each 100. Conclusion The best of the Chinese ETFs are competitive on a risk~reward tradeoff basis with the best of the larger population of equities, and absolutely squash the prospects of SPY in virtually every column comparison save for price drawdown risk exposure. In the non-leveraged Chinese ETFs, many are becoming attractive. Disclosure: I/we have no positions in any stocks mentioned, and no plans to initiate any positions within the next 72 hours. (More…) I wrote this article myself, and it expresses my own opinions. I am not receiving compensation for it (other than from Seeking Alpha). I have no business relationship with any company whose stock is mentioned in this article. Share this article with a colleague
5 Ways To Beat The Market: Part-3 Revisited

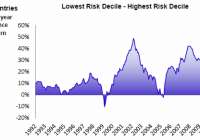
In a series of articles in December 2014, I highlighted five buy-and-hold strategies that have historically outperformed the S&P 500 (SPY). Stock ownership by U.S. households is low and falling even as the barriers to entering the market have been greatly reduced. Investors should understand simple and easy to implement strategies that have been shown to outperform the market over long time intervals. The third of five strategies I will revisit in this series of articles is the “low volatility anomaly” which has seen lower volatility stocks produce higher risk-adjusted returns over time. In a series of articles in December 2014, I demonstrated five buy-and-hold strategies – size, value, low volatility, dividend growth, and equal weighting, that have historically outperformed the S&P 500 (NYSEARCA: SPY ). I covered an update to the size factor published on Wednesday , and posted an update to the value factor on Thursday. In that series, I demonstrated that while technological barriers and costs to market access have been falling, the number of households that own stocks in non-retirement accounts has been falling as well. Less that 14% of U.S. households directly own stocks, which is less than half of the amount of households that own dogs or cats , and less than half of the proportion of households that own guns . The percentage of households that directly own stocks is even less than the percentage of households that have Netflix or Hulu . The strategies I discussed in this series are low cost ways of getting broadly diversified domestic equity exposure with factor tilts that have generated long-run structural alpha. I want to keep these investor topics in front of the Seeking Alpha readership, so I will re-visit these principles with a discussion of the first half returns of these strategies in a series of five articles over the next five days. Reprisals of these articles will allow me to continually update the long-run returns of these strategies for the readership. Without further ado, one of my favorite and most oft discussed strategies on Seeking Alpha… Low Volatility Since the groundwork behind the Modern Portfolio Theory was laid fifty years ago, it has been axiomatic that riskier portfolios should expect to be compensated with higher returns. More recent academic research has shown that this assumption holds less well at the extremes – the least risky stocks tend to outperform the most risky stocks on both a risk-adjusted and an absolute basis. In a 2012 paper by Nardin L. Baker of Guggenheim Investments and Robert A. Haugen of Haugen Custom Financial Systems entitled: ” Low Risk Stocks Outperform Within All Observable Markets of the World “, the pair demonstrated that in their thirty-three country sample the highest risk decile of stocks, rebalanced monthly, underperformed the lowest risk decile of stocks in each locale. Source: Nardin & Baker (2012) In 2013, Andrea Frazzini, David Kabiller, and Lasse Pedersen, each affiliated with hedge fund AQR Capital Management, published ” Buffett’s Alpha “, which deconstructed the return profile of Berkshire Hathaway ( BRK.A , BRK.B ). In “Buffett’s Alpha”, the authors determined that the public stocks owned by Buffett in 13F filings had only a market beta of 0.77 from 1980-2011. Over that thirty-one year period, Buffett outperformed the market while owning in the public portion of his portfolio securities which on average had only three-quarters of the market beta. At the 1999 Berkshire Hathaway Annual Meeting, Buffett, during the rising crescendo of the tech bubble stated: “We’re more comfortable in that kind of (traditional) business. It means we miss a lot of very big winners. But we wouldn’t know how to pick them out anyway. It also means we have very few big losers – and that’s quite helpful over time. We’re perfectly willing to trade away a big payoff for a certain payoff.” From the chart above by Haugen and Baker, the end of the 1990s was the period when the most volatile stocks were actually outperforming the least volatile stocks as earnings multiples for start-ups in the tech space reached stratospheric heights. Buffett, as his 1999 quote illustrates, chose to pass and his relative performance in the short-run faltered, but over the long run he avoided the tech bubble-fueled market meltdown. Missing these major market corrections has been a predominant source of Buffett’s sustainable alpha. This is consistent with the return profile for the low volatility strategy as seen in the cumulative graph of the S&P 500 Low Volatility Index versus the S&P 500 below. Low volatility stocks underperformed during the run-up to the tech bubble, but strongly outperformed in the aftermath and through the financial crisis. (click to enlarge) Source: Standard and Poor’s; Bloomberg Buffett has historically been called a “value investor”, but as we saw in my second article in this series, while value investing produces higher long-run returns, it also has higher variability of returns. The AQR researchers saw low volatility investing and leverage as key to Buffett’s success, and I have chosen to discuss them in this series as separate, but related strategies. From an analytic standpoint, the correlation coefficient of the S&P Pure Value Index and the S&P Low Volatility Index has been roughly equivalent to the correlation between the S&P 600 Smallcap Index ( covered in my first article in this series ) and low volatility stocks, and few would argue that the latter pair has exposure to similar risk factors. Certainly, Buffett’s ability to miss the bursting of the tech bubble was highly correlated with the return series for low volatility stocks above. If we can take a subset of the broader market, low volatility stocks, and demonstrate that they have outperformed, then another segment of the market must be underperforming. Over the twenty-year plus time period we are examining, high beta stocks have fit that mold, and that underperformance is captured in the graph of the cumulative returns of low volatility stocks and high beta stocks below: (click to enlarge) Source: Standard and Poor’s; Bloomberg Two of the three authors of “Buffett’s Alpha”, Andrea Frazzini and Lasse Heje Pederson also collaborated on ” Betting Against Beta ” where the researchers demonstrate that since leverage constrained investors bid up high-beta assets, that high beta is necessarily associated with lower alpha. The articles demonstrates the underperformance of high beta across more than 20 global equity markets and several fixed income markets. This analysis makes intuitive sense. Long-only active managers who are benchmarked against an index naturally seek higher beta assets as a means to outperformance, but the cumulative effect of this preference for riskier assets lowers their expected forward returns as compared to disfavored lower beta stocks. Behavioral explanations including lottery preferences, representativeness, and overconfidence have also been suggested for the relative underperformance of high volatility stocks. The S&P 500 Low Volatility Index is replicated through the exchange traded fund, Powershares S&P 500 Low Volatility Portfolio (NYSEARCA: SPLV ), which carries a 0.25% expense ratio. The raw beta of this fund over the trailing 1-year is just 0.84, which compares reasonably to the historical beta that Buffett had realized in the aforementioned study. My favorite part of this low volatility strategy for buy-and-hold investors with a long-term horizon is that the strategy has outperformed when the stock market has been falling, besting the broader market in 2000-2002 and 2008. The low volatility strategy underperformed the most in 1998 and 1999 as tech multiples ballooned and Buffett was forced to defend his underperformance, but the strategy far outpaced the broader market in the 2000-2002 correction. While low volatility stocks have historically outperformed the broader market, they lagged in the first half of 2015. Part of this underperformance mirrors the weak relative performance by low volatility stocks during the rate-related selloff in 1994 (see first half returns below). As the rate selloff in 2015 has reversed in the very early days of the second half of the year, low volatility stocks have outperformed the broader market by nearly 2%, quickly erasing over half of their year-to-date deficit. While the Low Volatility Index will be more sensitive to higher interest rates than other segments of the equity market, I continue to expect that low volatility stocks will continue to offer attractive risk-adjusted returns over the business cycle. As I wrote in my 10 Themes Shaping Markets in the Back Half of 2015 , stretched equity multiples domestically will necessitate that valuations be driven by changes in earnings, tempering further price gains. As equity prices rise, investors may look to opportunistically rotate into underperforming rate-sensitive assets and lower volatility assets. Given the tendency for lower volatility assets to outperform in falling markets, investors may desire to rotate to lower volatility stocks which have underperformed in 2015. I will be publishing updated results for two additional proven buy-and-hold strategies that can be replicated through low cost indices over the next couple of days. Disclaimer My articles may contain statements and projections that are forward-looking in nature, and therefore inherently subject to numerous risks, uncertainties and assumptions. While my articles focus on generating long-term risk-adjusted returns, investment decisions necessarily involve the risk of loss of principal. Individual investor circumstances vary significantly, and information gleaned from my articles should be applied to your own unique investment situation, objectives, risk tolerance, and investment horizon. Disclosure: I am/we are long SPY, SPLV. (More…) I wrote this article myself, and it expresses my own opinions. I am not receiving compensation for it (other than from Seeking Alpha). I have no business relationship with any company whose stock is mentioned in this article.