Tag Archives: nysearcaspy

Today’s Most Competitive Emerging Country ETF Investment

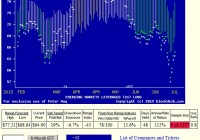
Summary From a population of some 350 actively-traded, substantial, and growing ETFs this is a currently attractive addition to a portfolio whose principal objective is wealth accumulation by active investing. We daily evaluate future near-term price gain prospects for quality, market-seasoned ETFs, based on the expectations of market-makers [MMs], drawing on their insights from client order-flows. The analysis of our subject ETF’s price prospects is reinforced by parallel MM forecasts for each of the ETF’s ten largest holdings. Qualitative appraisals of the forecasts are derived from how well the MMs have foreseen subsequent price behaviors following prior forecasts similar to today’s. Size of prospective gains, odds of winning transactions, worst-case price drawdowns, and marketability measures are all taken into account. Today’s most attractive ETF Is the ProShares Ultra MSCI Emerging Markets ETF (NYSEARCA: EET ). Yahoo Finance profiles this ETF as follows: The investment seeks daily investment results, before fees and expenses, that correspond to two times (2x) the daily performance of the MSCI Emerging Markets Index®. The fund invests in securities and derivatives that ProShare Advisors believes, in combination, should have similar daily return characteristics as two times (2x) the daily return of the index. The index includes 85% of free float-adjusted market capitalization in each industry group in emerging market countries. The fund is non-diversified. The fund currently holds assets of $37.5 million and has had a YTD price return of +1.9%. Its average daily trading volume of 14,205 produces a complete asset turnover calculation in 41 days at its current price of $64.90. A typical bid~offer spread is 0.6%. Behavioral analysis of market-maker hedging actions while providing market liquidity for volume block trades in the ETF by interested major investment funds has produced the recent past (6 month) daily history of implied price range forecasts pictured in Figure 1. Figure 1 (used with permission) The vertical lines of Figure 1 are a visual history of forward-looking expectations of coming prices for the subject ETF. They are NOT a backward-in-time look at actual daily price ranges, but the heavy dot in each range is the ending market quote of the day the forecast was made. What is important in the picture is the balance of upside prospects in comparison to downside concerns. That ratio is expressed in the Range Index [RI], whose number tells what percentage of the whole range lies below the then current price. Today’s Range Index is used to evaluate how well prior forecasts of similar RIs for this ETF have previously worked out. The size of that historic sample is given near the right-hand end of the data line below the picture. The current RI’s size in relation to all available RIs of the past 5 years is indicated in the small blue thumbnail distribution at the bottom of Figure 1. The first items in the data line are current information: The current high and low of the forecast range, and the percent change from the market quote to the top of the range, as a sell target. The Range Index is of the current forecast. Other items of data are all derived from the history of prior forecasts. They stem from applying a T ime- E fficient R isk M anagement D iscipline to hypothetical holdings initiated by the MM forecasts. That discipline requires a next-day closing price cost position be held no longer than 63 market days (3 months) unless first encountered by a market close equal to or above the sell target. The net payoffs are the cumulative average simple percent gains of all such forecast positions, including losses. Days held are average market rather than calendar days held in the sample positions. Drawdown exposure indicates the typical worst-case price experience during those holding periods. Win odds tells what percentage proportion of the sample recovered from the drawdowns to produce a gain. The cred(ibility) ratio compares the sell target prospect with the historic net payoff experiences. Figure 2 provides a longer-time perspective by drawing a once-a week look from the Figure 1 source forecasts, back over two years. Figure 2 (used with permission) What does this ETF hold, causing such price expectations? Figure 3 is a table of securities held by the subject ETF, indicating its concentration in the top ten largest holdings, and their percentage of the ETF’s total value. Figure 3 (click to enlarge) Source: Yahoo Finance This shows how leveraged ETFs do their magic. The top ten holdings of EET are mainly swaps contracts in the iShares MSCI Emerging Markets ETF (NYSEARCA: EEM ), with a value per share of 184.57% of the EET share. The 4.01% in bonds helps balance out the 2x relationship of price change in EET with the underlying Emerging Markets Index security. But that doesn’t tell much about what the investor has driving his investment. To find that out, we look at the holdings of EEM: Source: Yahoo Finance That’s better, and shows the emphasis on Financial Services and Technology, making up almost half of the portfolio. Unfortunately, the offshore nature of virtually all the underlying equity holdings are ones that we do not have information support from arbitrage activities in derivative markets, so our analysis of this dimension of EET must stop here. In markets as unpredictably dynamic as this, wide variations in market experience seem to be the rule. A comparison of the data row for EET from Figure 1 with a similar one from an ETF proxy for the U.S. market helps to highlight the unique and attractive features of EET. For EET: For the SPDR S&P 500 Trust ETF (NYSEARCA: SPY ) : The Sell Target for EET offers 3 times as much potential gain as the U.S. market proxy, SPY. But it exposes the investor to worst-case price drawdown exposure that is more than twice as large. Still, taking Sell Target and Drawdown as Reward and Risk elements, EET is favored with a ratio of 3 to 1, rather than SPY’s 2 to 1. Just as importantly, the ability to recover from extreme price drawdowns and achieve some or all of the upside potential is indicated by each one’s Win Odds out of 100. For the U.S. market proxy that desired objective has been accomplished 7 out of every 8 times. EET has achieved it a bit better than 6 out of 8. But the payoff for EET at a net (including losses) average of +15.6% is 5 times bigger than the U.S. market’s +3.5%. Since both alternative investments took 9-10 weeks to achieve their gains, the Annual Rates of Return [AROR] from price change gains is also 5 times better, 115% to 21%. EET’s relatively small sample of prior experiences, only 9 in the past 5 years is not surprising or troubling, given its presently depressed price, relative to its forecast. That is measured by its Range Index. When negative, it tells by how much the current market quote is below the least justifiable forecast price. Here a -43 means it is cheap by nearly half its total forecast price range. The U.S. market proxy, on the other hand is presently priced right about at its mid-point, with only slightly more upside than downside. A quick reference to the small thumbnail picture in Figure 1, of the past 5 years distribution of Range indexes, emphasizes how extreme (and opportune) is the current pricing. Conclusion EET provides attractive forecast price gains, supported by a recognized index of major established investments in emerging countries. The daily forecast graphic and its weekly extracts over the longer period of two years demonstrate the cyclic nature of the ETF. Its dynamic character offers an opportune point in time to take advantage of world events that may be distracting investors’ attention from the potentials presented here. Disclosure: I/we have no positions in any stocks mentioned, and no plans to initiate any positions within the next 72 hours. (More…) I wrote this article myself, and it expresses my own opinions. I am not receiving compensation for it (other than from Seeking Alpha). I have no business relationship with any company whose stock is mentioned in this article.
5 Ways To Beat The Market: Part 5 Revisited

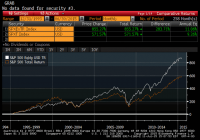
Summary •In a series of articles in December 2014, I highlighted five buy-and-hold strategies that have historically outperformed the S&P 500 (SPY). •Stock ownership by U.S. households is low and falling even as the barriers to entering the market have been greatly reduced. •Investors should understand simple and easy to implement strategies that have been shown to outperform the market over long time intervals. •The final of five strategies I will revisit in this series of articles is equal weighing, a contrarian “buy low, sell high” approach to index rebalancing. In a series of articles in December 2014, I demonstrated five buy-and-hold strategies – size, value, low volatility, dividend growth, and equal weighting, that have historically outperformed the S&P 500 (NYSEARCA: SPY ). I covered an update to the size factor published on Wednesday, posted an update to the value factor on Thursday, covered the Low Volatility Anomaly on Friday, and tackled the Dividend Aristocrats yesterday . In that series, I demonstrated that while technological barriers and costs to market access have been falling, the number of households that own stocks in non-retirement accounts has been falling as well. Less that 14% of U.S. households directly own stocks, which is less than half of the amount of households that own dogs or cats , and less than half of the proportion of households that own guns . The percentage of households that directly own stocks is even less than the percentage of households that have Netflix or Hulu . The strategies I discussed in this series are low cost ways of getting broadly diversified domestic equity exposure with factor tilts that have generated long-run structural alpha. I want to keep these investor topics in front of the Seeking Alpha readership, so I will re-visit these principles with a discussion of the first half returns of these strategies in a series of five articles over the next five days. Reprisals of these articles will allow me to continually update the long-run returns of these strategies for the readership. Equal Weighting The S&P 500 Equal Weight Index is a version of the S&P 500 where the constituents are equal weighted as opposed to the traditional market capitalization weighting of the benchmark gauge. Guggenheim S&P 500 Equal Weight ETF (NYSEARCA: RSP ) replicates this alternative weight index. When the equal-weighted version of the index is rebalanced quarterly to return to equal weights, constituents which have underperformed are purchased and constituents which have outperformed are reduced, a contrarian strategy that has produced excess returns relative to the capitalization-weighted S&P 500 index over long-time intervals. Equal-weighting also gives an investor a greater average exposure to smaller capitalization stocks, a risk factor, detailed in the first article in this series , for which investors have historically been compensated with higher average returns. The composition of the equal-weighted index is more consistent with mid-cap stocks, which have historically outperformed large caps. The graph below shows the cumulative return of the S&P 500 Equal Weight Index relative to the cumulative return of the capitalization-weighted S&P 500 Index. (click to enlarge) Research by Plyakha, Uppal, and Vilkov (2012) puts some data behind my narrative that the size factor and contrarian rebalancing drive alpha in equal weighting strategies. Their analysis found that the higher systematic return of equal weighting relative to capitalization-weighted portfolios arose from relatively higher exposure to the size and value factors described in the first two articles in this series. The higher alpha of the equal-weighted strategy was determined to arise from periodic rebalancing, a contrarian strategy that exploits time-series properties of stock returns. The S&P 500 currently has a 17.1% weighting towards its ten largest constituents. Over one-sixth of the value of the broad market gauge is attributable to one-fiftieth of its components. To demonstrate the value of the size factor to equal-weighting, we should see the S&P 500 outperform the S&P 100 over the same twenty-year time interval. The S&P 100 Index, the hundred largest constituents of the S&P 500, trailing the S&P 500 by 11bps per year. If the contrarian rebalancing in equal-weighting also creates alpha, we should see an equal-weighted S&P 100 outperform a capitalization-weighted S&P 100. While I do not have data on the total return of an equal-weighted S&P 100 Index for 20 years, I do have fourteen years of data that show that an equal weighted index would have outperformed the capitalization-weighted index by 1.77% per year since the beginning of 2001. When I have previously discussed equal-weighting the S&P 500, some readers have commented that this is simply a mid-cap strategy, owing all of its outperformance to the size factor, but I hope this data shows that the contrarian re-balancing is also an important piece of the structural alpha gleaned through equal-weighting. Some of the most powerful ideas in finance are the easiest and simplest to implement. At its core, equal weighting overcomes the bias inherent in the capitalization-weighted benchmark index that forces investors to hold larger proportions of stocks that have risen in value. Periodic rebalancing allows the strategy to “buy low and sell high”, still the most tried and true way of making money in financial markets. Each of the five strategies I have outlined in this series share this notion that sometimes the best ideas are the simplest. I hope long-term buy-and-hold investors consider the size, value, low volatility, consistent dividend growth, and equal weighting approaches that have been demonstrated to outperform the market. Each of these factor tilts gleans their outperformance from slightly different risk factors, which should generate risk-adjusted outperformance over multiple business cycles. Low Volatility will have better performance in the down-turn, the size and value factors should generate outperformance in the recovery. I conclude this series of articles with a combined twenty plus year history of their total returns. The mix columns is an equal-weighting of the five different strategies. (You now also know that periodic rebalancing of these different strategies could enhance the alpha generated.) Over twenty-years, these strategies each produced higher absolute returns than the S&P 500 and higher average returns per unit of risk. Combining these strategies would have generated a 2.1% annualized outperformance with less than 90% of the variability of returns. A 2.1% annualized outperformance over this long time frame would have meant that investors who employed these strategies for twenty years would have had nearly a 50% higher nest egg today. (click to enlarge) With the return series side-by-side, readers should notice that Low Volatility stocks and the Dividend Aristocrats outperformed in weak equity years (2000-2002, 2008). Value stocks and small cap stocks have outperformed in the early stages of economic recoveries (2003, 2009). Understanding how these five strategies perform in different parts of the business cycle is a key towards value-accretive asset allocation. Thanks to all of my readers who contributed thoughtful comments on this series. Long-time readers may be surprised that momentum, a topic I have covered in many past articles, did not make it into my five strategies. The paired switching strategies in my momentum articles have also “beat the market”, but did so with a different source of alpha than the “buy and hold” approaches that I wished to spotlight in this series. Future work will follow-up on reader questions emanating from theses articles. Additional articles will also focus on combinations of these strategies that could well serve long-term investors. Disclaimer: My articles may contain statements and projections that are forward-looking in nature, and therefore inherently subject to numerous risks, uncertainties and assumptions. While my articles focus on generating long-term risk-adjusted returns, investment decisions necessarily involve the risk of loss of principal. Individual investor circumstances vary significantly, and information gleaned from my articles should be applied to your own unique investment situation, objectives, risk tolerance, and investment horizon. Disclosure: I am/we are long RSP, SPY. (More…) I wrote this article myself, and it expresses my own opinions. I am not receiving compensation for it (other than from Seeking Alpha). I have no business relationship with any company whose stock is mentioned in this article.
Are Rate Spreads And Volatility Good Market-Timing Indicators?

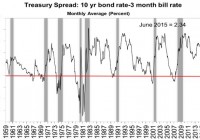
Summary This is part of a research on systemic market indicators. A summary on two rate spreads and the VIX index used as market timing indicators. A reminder of a 4-component systemic indicator presented in a former article. MTS (Multi-Timing Scores) are systemic aggregate indicators, focused on a long-term investing horizon and including the 4 main categories of market analysis: sentiment, economy, fundamentals, technicals. MTS10 is used in GHI Premium Service to send market timing alerts and size a hedge according to the systemic risk. A GHI subscriber asked me if adding parameters on credit spreads and volatility might improve it. Here is a summary of my thoughts on 3 related indicators. 10-year / 3-month spread Yield curve inversion (when long-term yields fall below shorter-term yields) has been studied in academic publications as a predictor of economic recessions in the US and other countries. The most studied data in the U.S. is the spread between rates of the 10 year bond (NYSEARCA: IEF ) and the 3 month bill (NYSEARCA: BIL ). It has worked quite well to predict recessions since 1960, with only 1 miss (the spread didn’t cross the zero line before 1960 recession) and two false signals in 1966-67. However, it gives little information about the timing. It just tells that a recession may happen in the next 6 to 20 months. Moreover, the signal (negative spread) may have disappeared before the recession really starts. It looks useful for economists and politicians, but of little help for investors. (click to enlarge) Source: New York FED As the average elapsed time between a negative spread and a recession is about 1 year, some economists have inferred a probability of recession 12 months ahead. This method predicts a probability of recession below 5% until June 2016. (click to enlarge) TED Spread The TED spread is the difference between the 3-month LIBOR and the 3-month U.S. T-bill rate. For this one, a spike is a bad omen. It did a good job at “predicting” the 1987 crash (in fact I doubt that someone was interested in it at this time) and the 2008 recession. But it was late in 1990, gave a bunch of false signals, missed the 2001 recession, and gave a late signal in 2011 during the latest meaningful market correction. (click to enlarge) Source: Saint Louis FED VIX index The VIX index measures an aggregate implied (expected) volatility on S&P 500 stocks calculated from their options. It is known as the “fear index” and may be seen as an indicator of the cost of insurance against a large market move. It usually goes up when stock indices go down. The VIX can be traded using futures, options and ETNs ( VXX , VXZ ). Two of its most interesting properties are: an attraction to its moving averages a higher probability to go up again after a day up The risk increases when the VIX goes away from its average to the downside (a sign of possible complacency) or to the upside (a sign of nervousness). It is easier to put a trigger on the downside because both properties above play in the same direction. They are opposite when the VIX goes up, making the game riskier. The next chart represents the equity curve of investing in SPY , and going in cash when the VIX is below 2% under its 10-day simple moving average (benchmark in blue is SPY “buy-and-hold”). The choice of a 10-day sma is not random, it is well-known by traders interested in the VIX. (click to enlarge) Source: portfolio123 The chart looks great, but there are a lot of intra-week signals. Global Household Index is weekly. The performance of a weekly signal is much less attractive: (click to enlarge) It is even worse with a 0.1% rate for transaction cost ($10 for $10k): (click to enlarge) I think the VIX may be very useful in setups for swing-traders, much less for investors with a mid-term or long-term horizon. This is not an original idea: in this article Mark Hulbert came to the same with other arguments. Conclusion : The 10-year / 3-month credit spread is a good recession predictor, but not a good timer. The TED spread has given timely qualitative signals twice in the past, but signals were late, missing or flawed in other cases. I didn’t find a way to use it in a quantitative indicator. The VIX index gives signals that can be used as confirmations by traders, but doesn’t seem to be a great help for investors working in weekly or longer time units. I don’t plan to integrate these indicators in my market timing scores. MTS10 components cannot be disclosed here. Interested readers can use for non-commercial purposes ( CC BY-NC 4.0 International License ) an open-source variant with 4 indicators (MTS4). It is less robust and more sensitive to economic data revisions. The component indicators are S&P 500 companies’ average short interest (bearish when the 52-week sma is above the 104-week sma); unemployment (bearish when above its value 3 months earlier); S&P 500’s current-year EPS estimate (bearish when below its value 3 months earlier); and S&P 500’s price (bearish when the 50-day sma is below the 200-day sma). When all four are bearish, it’s time to go in full hedge. This page explains how to get a limited free access to MTS4 in a popular screener, backtest it and get its value at any time. Disclosure: I/we have no positions in any stocks mentioned, and no plans to initiate any positions within the next 72 hours. (More…) I wrote this article myself, and it expresses my own opinions. I am not receiving compensation for it (other than from Seeking Alpha). I have no business relationship with any company whose stock is mentioned in this article.