Tag Archives: nysearcasplv

Low Volatility Stocks And Maximum Drawdowns

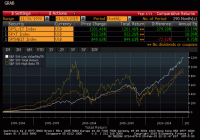
Low volatility equity strategies have been shown to have historically produced higher risk-adjusted returns, a violation of models that expect higher risk to be compensated with higher returns. Low volatility strategies have produced higher returns because they have outperformed in falling markets. This article details the lower maximum drawdowns of a low volatility strategy, showing the worst returns for the strategy over various time intervals versus the broader market. I have written a number of articles about the Low Volatility Anomaly , and how lower beta stocks have produced higher absolute and risk-adjusted returns than high beta stocks over time. The returns of the S&P Low Volatility Index, the S&P 500, and the S&P 500 High Beta Index since 1990 are compared below: (click to enlarge) Source: Bloomberg, Standard and Poor’s A tilt towards lower volatility stocks was one of my five strategies for outperformance for buy-and-hold investors . Low volatility strategies outperform because they suffer lower drawdowns in tough market environments, but capture most of the upside in bull markets , which is demonstrable in the graph above. In comments on a recent article, a reader queried about what the maximum drawdowns have been for low volatility equity strategies. Using data from the S&P Low Volatility Index (replicated by SPLV ), which measures the performance of the one-hundred least volatile components of the S&P 500, I have captured maximum drawdowns over various time horizons and compared these drawdowns to those of the S&P 500 Index (NYSEARCA: SPY ). (click to enlarge) Unsurprisingly, the worst drawdowns for the Low Volatility strategy and the broader equity market overlapped during the financial crisis. On average, the drawdown for the Low Volatility Index was only two-thirds to three-quarters of the broader market. Over ten year periods, the Low Volatility strategy have always produced positive returns, but this is an admittedly short dataset (1990-current), covering just three business cycle troughs. Disclaimer: My articles may contain statements and projections that are forward-looking in nature, and therefore inherently subject to numerous risks, uncertainties and assumptions. While my articles focus on generating long-term risk-adjusted returns, investment decisions necessarily involve the risk of loss of principal. Individual investor circumstances vary significantly, and information gleaned from my articles should be applied to your own unique investment situation, objectives, risk tolerance, and investment horizon. Disclosure: The author is long SPLV, SPY. (More…) The author wrote this article themselves, and it expresses their own opinions. The author is not receiving compensation for it (other than from Seeking Alpha). The author has no business relationship with any company whose stock is mentioned in this article.
Low Volatility ETFs Delivering Again In 2015

Summary The equities market is experiencing another bout of volatility. Low-volatility stock ETFs are outperforming the broader market. A closer look at low-volatility ETF strategies and sector tilts. The new year is still young, but investors have already been subjected to wild rides by major equity benchmarks. For example, the S&P 500 started 2015 on a downbeat note only to see all of those losses and then some erased by the end of last week, but a dismal showing this week has the benchmark U.S. index down nearly 3% year-to-date. Low volatility exchange-traded funds, including the PowerShares S&P 500 Low Volatility Portfolio ETF (NYSEARCA: SPLV ) and the iShares MSCI USA Minimum Volatility ETF (NYSEARCA: USMV ) are doing what they are supposed: outperform traditional benchmarks during times of market angst. The average year-to-date for SPLV and USMV is less than a half a percent, but that is clearly better than the 2.8% shed by the S&P 500. Notably, SPLV’s and USMV’s outperformance of the S&P 500 comes after the low volatility duo produced an average return of 18.7% last year, about 550 basis points better than the S&P 500 . “Within SPLV, seven of the ten largest holdings have an S&P Capital IQ Quality Ranking of B+ or above, with one with no ranking,” said S&P Capital IQ in a new research note. Dow components Wal-Mart (NYSE: WMT ) and Procter & Gamble (NYSE: PG ) are SPLV’s two largest consumer staples holdings. With an allocation of 16.5%, consumer staples is the third-largest sector weight in the ETF behind financials and utilities. P&G and Wal-Mart are also of the most reliable dividend growers among U.S. companies and although SPLV is not a dedicated dividend ETF, the fund has a trailing 12-month yield of almost 2.2%. That is 50 basis points above 10-year Treasuries, and SPLV pays its dividend monthly. “Though a company’s strong earnings and dividend record are not necessarily indicative of it having below-average volatility, our research has found many such companies have modest risk profiles,” said S&P Capital IQ. The research firm notes that SPLV’s exposure to financial services names is, not surprisingly, confined to lower beta fare such as insurance providers and real estate investment trusts (REITs). “In 2014, we saw defensive consumer staples, REITs, and utilities stocks perform relatively well as interest rates have declined and international economies such as Europe and Japan fall into recession. These stocks typically offer above-average dividend yields and are focused more on the U.S. where economic growth has been relatively impressive,” said S&P Capital IQ. As is often the case, there is a price to pay for playing defensive and it comes in the form of the higher valuations often ascribed to defensive sectors. Consumer staples and utilities are two of the most expensive sectors compared to the S&P 500. Add to that, S&P Capital IQ sees the bulk of SPLV’s 99 holdings as fairly valued, but the research maintains an overweight rating on the ETF. PowerShares S&P 500 Low Volatility Portfolio (click to enlarge)

Low-Volatility ETFs Outperform In Shaky Market Conditions

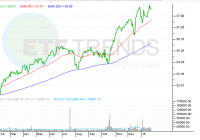
Summary Volatility in the markets is rising. Low-volatility stock ETFs are outperforming. A closer look at two low-vol ETFs. Low-volatility exchange traded funds that have taken a more cautious approach have outperformed the broader equities market as short-term concerns unbalanced stocks’ march upward. Over the past year, the PowerShares S&P 500 Low Volatility Portfolio ETF (NYSEArca: SPLV ) gained 19.2% and iShares MSCI USA Minimum Volatility ETF (NYSEArca: USMV ) rose 18.2%. Year-to-date, SPLV was up 0.1% and USMV was 0.5% higher. In contrast, the S&P 500 index increased 13.5% over the past year and fell 1.7% year-to-date. Market volatility is spiking as concerns mount over the potential effects of a plunge in crude oil prices. The CBOE Volatility Index, or VIX, closed at 21.6 Wednesday, compared to its historical range between 15 and 20. The VIX, a gauge of demand for protection against losses in U.S. equities, has oscillated more than 10% in three trading sessions since December 31. “Every time oil goes down into a new range, those fears reignite,” Paul Zemsky, head of multi-asset strategies at Voya Investment Management LLC, said in a Bloomberg article. “Will something happen in Russia? Will a hedge fund blow up? Which banks will get hammered by this?” However, a rise in volatility has helped the least volatile stocks standout. Moreover, low-volatility equities are experiencing greater demand due to low interest rates. Traditionally, investors would turn to fixed-income assets to diminish risk exposure. However, with rates more likely to rise and the U.S. economy expected to continue expanding, investors have turned to low-volatile stock options to capture a growing equities market and to hedge some of the market risks. For instance, both SPLV and USMV overweight outperforming defensive sector stocks. Specifically, SPLV includes a 20.2% tilt toward health care and 16.0% in consumer staples. USMV has 18.4% utilities and 15.6% consumer staples. Both ETFs also underweight the energy sector, the worst performing area of the market. SPLV takes 100 stocks from the S&P 500 that have exhibited the lowest volatility over the past year and weights holdings by the inverse of their volatility, so the largest components show the least amount of volatility. USMV also tracks low volatility stocks, but the ETF targets variances and correlations for all stocks, along with other risk factors. PowerShares S&P 500 Low Volatility Portfolio (click to enlarge) Max Chen contributed to this article .