Tag Archives: nysearcash

Bulls Hiding Behind Bears

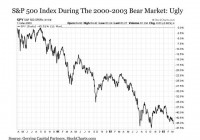
Summary Many investors understandably reflect on the past two bear markets in stocks with dread. But just because the S&P 500 Index is down does not mean that major segments within the stock market cannot go up at the same time. It also does not mean that other asset classes are not enjoying roaring bull markets. A truly diversified portfolio strategy should be continuously exploring this opportunity set from both a timing and allocation standpoint. Many investors understandably reflect on the past two bear markets in stocks with dread. Not only did many have a bad experience the first two times around, but they look at today’s bull market and may have some concern that a third go around may be lurking around the corner. But investors should not fear. For just because the major stock market indices such as the S&P 500 Index took a beating the last time around, it does not mean that every stock on the planet went down. And it also does not mean that a lot of investors in other frequently overlooked asset classes were not able to generate handsome returns while investors were fleeing out of stocks. More often than not, one can always find bulls hiding behind bears in investment markets. You just have to look for them. Remembering The 2000 to 2003 Bear Market In Stocks Our first look is at the S&P 500 Index (NYSEARCA: SPY ) in the aftermath of the tech bubble bursting. From its peak in March 2000 until its final bottom in March 2003; in a word, it was ugly, as S&P 500 Index lost nearly half of its value even after dividends over this time period. (click to enlarge) But even sticking with the broader market, here is the first important point to recall. Stocks typically do not go down in a straight line. For during the 2000 to 2003 bear market, the S&P 500 Index did provide investors with several tradable rallies in with positive returns in excess of double digits along the way. The key was identifying the trend to catch these rallies. But capturing this upside, of course, is far easier said than done, and many investors would understandably rather not be bothered with attempting to trade the market in this manner. (click to enlarge) Fortunately for investors, the stock market at the time provided abundant upside opportunities. After all, a great deal of the damage from the tech bubble was sustained in the technology sector (NYSEARCA: XLK ), which lost a remarkable -82% at the depths of the 2000 to 2003 bear market. (click to enlarge) So as long as you were out of the way of the once high-flying technology sector at the time, you likely fared much better than the broader market. Viewing the stock market on a sector basis demonstrates why. Of the eight other GICS sectors that are represented by the Select Sector SPDR Indices, only four even entered into bear market territory at down -20% from the S&P 500 Index peak in March 2000. Among the cyclical sectors, Industrials (NYSEARCA: XLI ) were down -37%, Consumer Discretionary (NYSEARCA: XLY ) was down -26%, Materials (NYSEARCA: XLB ) were down -23% and Energy (NYSEARCA: XLE ) fell -19%. What is more notable is the timing of these declines, as three of these four sectors were still in positive territory from the peak of the S&P 500 Index in March 2000 up until June 2002. In other words, if you were still fully in stocks more than two years after the start of the bear market, you were likely well attuned to the risks around you at that point. (click to enlarge) As would be expected, the performance among defensive stocks was even better. Consumer Staples (NYSEARCA: XLP ) only fell -13%, Health Care (NYSEARCA: XLV ) was down just -18%, Utilities (NYSEARCA: XLU ) dropped by -31% and interest rate sensitive financials were lower by -19%. In short, three of four sectors avoided bear market territory altogether. Moreover, Consumer Staples were up as much as +30% and Financials and Utilities as much as +10% as late as early 2002. What the heck happened to utilities at the time? This was a time when the typically staid utilities were deregulating and engaging in such ventures as electricity trading and telecom activities. Many have returned to their more traditional activities in the years since. (click to enlarge) Of course, the stock market is not the only place to allocate capital, and many investors in different asset classes enjoyed tremendous upside returns while stocks were moving lower. Some were in fact in impressive bull markets. For example, long-term U.S. Treasury bonds (represented here by the Vanguard Long Term Treasury Fund (MUTF: VUSTX )) were soaring by as much as +45% during the bear market in stocks. And gold (NYSEARCA: GLD ) gained over +20% after a slow start, as the shift toward a weak dollar in early 2001 helped spark the dawn of a new secular bull market in the yellow metal. (click to enlarge) The key takeaway from the 2000 to 2003 bear market — as long as you were out of the way of the frothiest areas of the market at the time, which were technology, media and telecom stocks — you likely fared much better. Much of the declines in value that you sustained would have been concentrated over a fairly short time of less than a year from the summer of 2002 through the spring of 2003. And if you were diversified beyond stocks in other uncorrelated to negatively correlated categories like Treasuries (NYSEARCA: TLT ) and gold, you may have even been able to break even if not generate a positive return over the duration of this stock bear market from 2000 to 2003. Remembering The 2007 to 2009 Bear Market In Stocks Now the bear market in stocks that accompanied the financial crisis from 2007 to 2009 was far more unforgiving. But that still does not mean that gains were not there to be had for those that were positioned correctly. From a stock market perspective, it was a fairly unforgiving time. Overall, the S&P 500 Index declined by -54%, and unlike the preceding bear market it managed to take just about every sector down with it. (click to enlarge) The standout to the downside, of course, was the financial sector, which lost -82% of its value. (click to enlarge) Cyclicals in general followed the path of the S&P 500 Index to the downside. The lone exception was the Energy and Materials sectors, which made a decent go of it through the summer of 2008 before finally capitulating to the downside. (click to enlarge) Defensive sectors did hold up better, but not enough where one would feel good about their overall experience. Consumer Staples stocks fared the best having fallen by -27%, while Health Care and Utilities were down in the neighborhood of -40%. What was notable, however, was that both Consumer Staples and Utilities were still in positive territory in the second half of 2008 before finally giving up to the downside once the effects of the Lehman failure and its aftermath started to spread like wildfire. (click to enlarge) Up to this point, we already have a key takeaway for stock investors. Yes, the entire stock market was soundly beaten during the financial crisis bear market by the time March 2009 rolled around, but it is not as though every sector was completely obliterated all at once. We were more than a year into the bear market at the time by the summer of 2008, and four out of nine stock market sectors were still in positive territory. The lesson? Even the worst of bear markets gives you time to act and get out if needed, as long as you are not invested at the epicenter of the problem, which was the financial sector this time around. But for the investor that wishes to avoid such losses that might come with any future bear market in stocks, what are they to do? The answer — recognize that to be invested does not mean that you must be exclusively invested in the stock market. Nor do you have to be exclusively invested anywhere else for that matter, including bonds, commodities, cash or anything else for that matter. For just as the stock market was struggling through a difficult bear market from 2007 to 2009, a number of other asset classes were enjoying rousing bull markets. Case in point. Let’s revisit long-term U.S. Treasuries. While it was a bear market in stocks at the time, it was a roaring bull market in U.S. Treasuries. Overall, the category advanced by more than +50% at a time when the stock market was down by more than -50%. Not too shabby. How about gold? The metal that so many like to deride gained +36% over the course of the financial crisis bear market. (click to enlarge) And for those that are more aggressively inclined, those that were short the stock market through a broadly defined unleveraged instrument such as the ProShares Short S&P 500 (NYSEARCA: SH ) at that time nearly doubled their investment. Another possibility is to allocate on the margins to the VIX and other volatility instruments (NYSEARCA: VXX ). (click to enlarge) It is critically important to note, however, that such inverse approaches are not for the faint of heart. Moreover, they must be handled with care from a timing standpoint. For anyone that has tried to short the market or incorporate an exposure to volatility in their portfolio since March 2009, the experience has been absolutely excruciating. It is also important to note that just because an asset class performed well during a past bear market in stocks does not mean it will necessarily do so the next time around. This, of course, is part of the ongoing portfolio analysis and monitoring to determine exactly what asset classes might perform best the next time around. Bottom Line When contemplating the next bear market in stocks, whether it comes tomorrow or three years from now (it has to happen sometime), investors should not be thinking about selling out of the stock market and running for the hills. Instead, they need to stay in the trenches and have a plan. Think about where the unstable hot zones might be in the current stock market and look to tread lightly in those areas. Consider where the more stable stock market segments reside today and search for opportunities to add incrementally to allocations. Remember that when the bear market finally starts, it is not going to take down every stock all at once. Some might even rise throughout much of the entire experience. And perhaps most importantly, remember that stocks are not the only place where your money has to be allocated if you are participating in capital markets today. More than ever, today’s markets offer investors a broad and diverse arsenal from which to draw to optimize their portfolio from an asset allocation standpoint and look to gain even when the broader stock market may be falling. Disclosure : This article is for information purposes only. There are risks involved with investing including loss of principal. Gerring Capital Partners makes no explicit or implicit guarantee with respect to performance or the outcome of any investment or projections made. There is no guarantee that the goals of the strategies discussed by Gerring Capital Partners will be met. Disclosure: The author has no positions in any stocks mentioned, and no plans to initiate any positions within the next 72 hours. (More…) The author wrote this article themselves, and it expresses their own opinions. The author is not receiving compensation for it (other than from Seeking Alpha). The author has no business relationship with any company whose stock is mentioned in this article. Additional disclosure: I am long stocks via the SPLV as well as selected individual names. I am long Treasuries via the IEF. I also hold a meaningful allocation to cash at the present time.
How To Design A Market Neutral Portfolio – Part 3

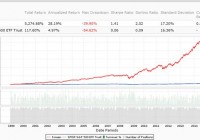
Summary How to build a robust long side. Which ETF on the short side. How to make it IRA-compliant. The first article of the series described the investor profile to hold a market neutral portfolio, some characteristics of this investing style. The second one explained the benefit of sector diversification, with examples. This one simulates solutions for the hedging position with various ETFs: leveraged and non leveraged, inverse and regular. People implementing an equity market neutral strategy usually have two balanced sets of individual stocks on both sides (long and short). Before going to the point, I want to come back on the reason why I prefer a single index ETF position on the short side. My opinion is that ‘Market Neutral’ is for risk-averse investors. Therefore it is also better to avoid a potentially unlimited risk that is not related to the market: being trapped in a short squeeze. People who think that this risk is limited to penny stocks and small caps have a short memory, or don’t know some cases. My preferred example is the ‘mother of all short squeezes’ that happened in 2008 when Volkswagen AG became briefly the highest capitalization in the world after its share price was multiplied by five in 2 days. Then it fell back to its initial level even more quickly. In the interval, investors and traders on the short side covered their positions at any price with huge losses, in panic or forced by their brokers. Whatever the reason (in this case a corner engineered by a major shareholder), and the consequences (at least a suicide has been attributed to that), I prefer avoiding by design this kind of event. Even absorbed in a diversified portfolio, such a shock hurts and may trigger a margin call for leveraged investors. On the long side… The quantitative models used for the long side of my real market neutral portfolio will not be disclosed here. However, I want to share some of its characteristics that may be reused by readers in another context. The portfolio is based on 5 different models: 2 with defensive stocks, 2 with cyclical stocks, 1 based on growth and valuation with no sector limitation. All models are based on rankings using fundamental factors. 24 stocks are selected: 14 in the S&P 500 index, 5 in the Russell 1000 index, 5 in the Russell 3000 index. The number of stocks has been chosen to limit the idiosyncratic risk. The sector diversification pattern should help beat the hedge in most phases of the market cycle. The diversification in rankings across models should limit the risk of over-optimization. The focus on large capitalizations is a choice of comfort (for myself) and ethic (for subscribers). Russell 3000 stocks are filtered on their average dollar daily volume. The portfolio is rebalanced weekly, but backtests show that a bi-weekly rebalancing doesn’t hurt the long-term performance. However, the hedge should always be rebalanced weekly. The next chart shows the simulation of this 24-stock portfolio (long side only) since 1999, with a 0.3% transaction cost and a 2-week rebalancing: (click to enlarge) Past performance, real or simulated, is never a guarantee of future returns. However, for a diversified portfolio like this one, it gives some clues about the robustness. Especially when robustness has been integrated from the design process, not just as the result of backtest optimization. On the short side… Some readers will be scared if I tell them abruptly that I use a leveraged 3x inverse ETF. Most people who are afraid of leveraged ETFs don’t really understand where their ‘decay’ comes from. If you exclude the management fee (under 1% a year), the decay has two names: roll-over cost and beta-slippage. The holdings of leveraged S&P 500 ETFs (inverse and regular) are swaps for the biggest part, and futures in second position. Rollover costs are close to zero for such contracts on the S&P 500. For beta slippage, some of my old articles have already explained what it is , and why I don’t fear it on S&P 500 leveraged ETFs. In short: most leveraged ETFs are harmful as long term holdings, but not all of them. The next table is a summary of backtests for the portfolio with different hedges, period 1/1/1999 to 11/29/2014 (weekly rebalancing). The ETF used are the ProShares Short S&P 500 ETF ( SH), the ProShares UltraShort S&P 500 ETF ( SDS), the ProShares UltraPro Short S&P 500 ETF ( SPXU) and the ProShares UltraPro S&P 500 ETF ( UPRO). For most cases it shows the performance without leverage, and with a leverage factor corresponding to holding the stocks on capital and the hedge on margin. Price data are synthetic before the inception dates (calculated by data provider). Hedge Leverage An.Ret. (%) DD (%) DL (weeks) K (%) No no 28 36 103 24 SH no 10 10 54 25 SH 2 23 23 54 25 SDS no 14 12 54 28 SDS 1.5 21 17 54 28 SPXU no 15 9 54 30 SPXU 1.33 21 11 54 30 UPRO (short) no 16 8 51 33 UPRO (short) 1.33 22 10 51 33 SPXU 50% no 20 17 51 34 SPXU 50% 1.167 24 19 51 34 SPXU 75% no 17 11 49 33 SPXU 75% 1.25 23 14 50 33 SPXU Timed no 25 15 50 34 SPXU HalfTimed no 20 10 48 36 SPXU HalfTimed 1.33 28 13 49 36 An.Ret.: annualized return DD: max drawdown depth on rebalancing (it may be deeper intra-week) DL: max drawdown length K: Kelly criterion of the weekly game, an indicator of probabilistic robustness The ‘Timed’ version uses a signal based on the 3-month momentum of the aggregate S&P 500 EPS and the U.S. unemployment rate. ‘Half Timed’ means that 50% of the hedging position is permanent, the other 50% is timed. Among the 100% market neutral versions, shorting UPRO looks better at first sight… but it is not after taking into account the borrowing rate (4.48% last time I had a look at UPRO properties in InteractiveBrokers platform). As it represents 25% of the total portfolio, the drag on the portfolio annual return is about 1%, which gives the same performance as with SPXU. I prefer buying SPXU and eliminating the inherent risk of short selling. Moreover, U.S. tax-payers can implement this kind of strategy in an IRA account if they use SPXU. Such a portfolio can be traded without leverage, but cash and IRA accounts usually have a 3-day settlement period. It is recommended trading at a broker offering a limited margin IRA feature waiving the settlement period and the risk of free-riding. It seems that Interactive Brokers and TD Ameritrade do that (and maybe others). Inform yourself carefully. Data and charts: Portfolio123 Additional disclosure: Long SPXU as a hedge.

How To Design A Market Neutral Portfolio – Part 2

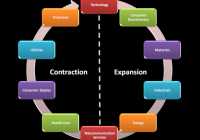
Summary Sector diversification is a key in market neutral investing. Two examples. Questions to solve for IRA compatibility. My previous article described the investor profile to hold a market neutral portfolio and some characteristics of this investing style illustrated by examples. I also explained why I prefer using an index ETF for the short side of the portfolio. In the next step, I want to focus on the benefit of sector diversification in market neutral investing. Sector diversification is especially important when the objective is to beat the benchmark in all market conditions, that is to say in all phases of the expansion-contraction cycle. The reality is more complicated than the figure. Cycles of different and variable periods may be in play, and macro trends can freeze the cycle for some sectors (like oil price does for energy and materials). In fact, it is sometimes quite difficult to figure out where we are and on which time frame when various cycles are combined. This is why, if an index ETF is on the short side, the long side of the portfolio must be diversified, not necessarily in all sectors, but at least in a few cyclical and defensive sectors. Since the return of such a Market Neutral Portfolio is the alpha of the long side, diversification in defensive and cyclical stocks is a key to keeping drawdowns acceptable in duration. In my opinion, the historical maximum duration in drawdown of an investing strategy is a parameter as important as the return and volatility. Examples I have performed a simulation of a portfolio mixing all the S&P 500 strategies of my book «The Lazy Fundamental Analyst» (Harriman House 2014). There are 9 strategies, one for each sector of the GICS classification, except Telecommunication (which is very small to elaborate statistical models). Each strategy selects 10 S&P 500 companies using a simple ranking process based on 2 fundamental factors. The factors are sector-dependent, chosen using historical statistics. The result is an equal-weighted portfolio of 90 stocks in a universe or 500, updated and rebalanced every 4 weeks. It is quite a big set (18% of the S&P 500 index) with various logics mixed, so the performance can hardly be suspected of being curve-fitted or random. Of course, past performance, real or simulated, is not a guarantee for future returns. But on such a portfolio it gives a good clue on the risk. The next chart shows the simulation of the 90-stock S&P 500 Lazy Portfolio (long side only) since 1999, with a 0.1% transaction cost and a 4-week rebalancing: (click to enlarge) The next table gives statistics of the excess return of the portfolio over the SPDR S&P 500 Trust ETF (NYSEARCA: SPY ) by 4-week periods, which corresponds to the market neutral portfolio with a leveraging factor 2, without the margin and carry cost for the “short half”. Average 4week return Average Annual return Max Drawdown Depth Max Drawdown Duration Avg gain / Avg loss 4week gain probability Kelly criterion Kelly crit. 95% confidence 0.94% 12.9% 20.5% 19 months 1.52 67% 0.46 0.35 Holding 90 stocks is a lot. In my real market neutral portfolio, I have reduced the number by: Excluding the most sensitive sectors to macroeconomic and geopolitical concerns: finance, energy and materials. My aim is not to get the best possible return, but a good return with a risk as low as possible. Optimizing the models to keep only 24 stocks with a diversification pattern, including at least 2 defensive sectors, 2 cyclical sectors and a minimum number of stocks in each of them. Optimizing to a lower number of stocks incurs a risk of curve fitting. However, with 24 holdings and various ranking logics, the risk remains quite low. The biggest danger of optimizing is not over-rating the possible return, but under-rating the real risk. In a diversified market neutral portfolio, the risk is limited by design. The next chart shows the simulation of my 24-stock portfolio (long side only) since 1999, with a 0.3% transaction cost and a 2-week rebalancing: (click to enlarge) This portfolio is more dynamic (rebalanced twice more often). It is also focused on large caps, but may hold a limited number of liquid small caps from the Russell 3000 index. Even if I use volume filters, I use a higher transaction cost to model a higher spread and slippage. The next table gives statistics of the excess return of the portfolio over SPY by 2-week periods, which corresponds to the market neutral portfolio leveraged twice, without the margin and carry cost. Average 2week return Average Annual return Max Drawdown Depth Max Drawdown Duration Avg gain/Avg loss 2week gain probability Kelly criterion Kelly crit. 95% confidence 0.79% 22% 11% 13 months 1.69 64.2% 0.43 0.36 These are examples. Ideas and steps can be reused with other quantitative models, or with a stock picking based on due diligence. The main idea here is to formalize and follow a sector-based diversification pattern. A next article will explain how to use leveraged ETFs to implement this strategy with a lower or no leverage (ProShares Ultra S&P 500 ETF (NYSEARCA: SSO ), ProShares UltraPro S&P 500 ETF (NYSEARCA: UPRO )), and the consequences of using inverse ETFs to avoid short selling (ProShares Short S&P 500 ETF (NYSEARCA: SH ), ProShares UltraShort S&P 500 ETF (NYSEARCA: SDS ), ProShares UltraPro Short S&P 500 ETF (NYSEARCA: SPXU )). Indeed market neutral investing can be implemented in an IRA account. Feel free to follow me if you don’t want to miss it. Data and charts: Portfolio123 Additional disclosure: Long SPXU as a hedge. Past performance is not a guarantee of future returns.