Tag Archives: nysearcasds

How To Design A Market Neutral Portfolio – Part 3

Summary How to build a robust long side. Which ETF on the short side. How to make it IRA-compliant. The first article of the series described the investor profile to hold a market neutral portfolio, some characteristics of this investing style. The second one explained the benefit of sector diversification, with examples. This one simulates solutions for the hedging position with various ETFs: leveraged and non leveraged, inverse and regular. People implementing an equity market neutral strategy usually have two balanced sets of individual stocks on both sides (long and short). Before going to the point, I want to come back on the reason why I prefer a single index ETF position on the short side. My opinion is that ‘Market Neutral’ is for risk-averse investors. Therefore it is also better to avoid a potentially unlimited risk that is not related to the market: being trapped in a short squeeze. People who think that this risk is limited to penny stocks and small caps have a short memory, or don’t know some cases. My preferred example is the ‘mother of all short squeezes’ that happened in 2008 when Volkswagen AG became briefly the highest capitalization in the world after its share price was multiplied by five in 2 days. Then it fell back to its initial level even more quickly. In the interval, investors and traders on the short side covered their positions at any price with huge losses, in panic or forced by their brokers. Whatever the reason (in this case a corner engineered by a major shareholder), and the consequences (at least a suicide has been attributed to that), I prefer avoiding by design this kind of event. Even absorbed in a diversified portfolio, such a shock hurts and may trigger a margin call for leveraged investors. On the long side… The quantitative models used for the long side of my real market neutral portfolio will not be disclosed here. However, I want to share some of its characteristics that may be reused by readers in another context. The portfolio is based on 5 different models: 2 with defensive stocks, 2 with cyclical stocks, 1 based on growth and valuation with no sector limitation. All models are based on rankings using fundamental factors. 24 stocks are selected: 14 in the S&P 500 index, 5 in the Russell 1000 index, 5 in the Russell 3000 index. The number of stocks has been chosen to limit the idiosyncratic risk. The sector diversification pattern should help beat the hedge in most phases of the market cycle. The diversification in rankings across models should limit the risk of over-optimization. The focus on large capitalizations is a choice of comfort (for myself) and ethic (for subscribers). Russell 3000 stocks are filtered on their average dollar daily volume. The portfolio is rebalanced weekly, but backtests show that a bi-weekly rebalancing doesn’t hurt the long-term performance. However, the hedge should always be rebalanced weekly. The next chart shows the simulation of this 24-stock portfolio (long side only) since 1999, with a 0.3% transaction cost and a 2-week rebalancing: (click to enlarge) Past performance, real or simulated, is never a guarantee of future returns. However, for a diversified portfolio like this one, it gives some clues about the robustness. Especially when robustness has been integrated from the design process, not just as the result of backtest optimization. On the short side… Some readers will be scared if I tell them abruptly that I use a leveraged 3x inverse ETF. Most people who are afraid of leveraged ETFs don’t really understand where their ‘decay’ comes from. If you exclude the management fee (under 1% a year), the decay has two names: roll-over cost and beta-slippage. The holdings of leveraged S&P 500 ETFs (inverse and regular) are swaps for the biggest part, and futures in second position. Rollover costs are close to zero for such contracts on the S&P 500. For beta slippage, some of my old articles have already explained what it is , and why I don’t fear it on S&P 500 leveraged ETFs. In short: most leveraged ETFs are harmful as long term holdings, but not all of them. The next table is a summary of backtests for the portfolio with different hedges, period 1/1/1999 to 11/29/2014 (weekly rebalancing). The ETF used are the ProShares Short S&P 500 ETF ( SH), the ProShares UltraShort S&P 500 ETF ( SDS), the ProShares UltraPro Short S&P 500 ETF ( SPXU) and the ProShares UltraPro S&P 500 ETF ( UPRO). For most cases it shows the performance without leverage, and with a leverage factor corresponding to holding the stocks on capital and the hedge on margin. Price data are synthetic before the inception dates (calculated by data provider). Hedge Leverage An.Ret. (%) DD (%) DL (weeks) K (%) No no 28 36 103 24 SH no 10 10 54 25 SH 2 23 23 54 25 SDS no 14 12 54 28 SDS 1.5 21 17 54 28 SPXU no 15 9 54 30 SPXU 1.33 21 11 54 30 UPRO (short) no 16 8 51 33 UPRO (short) 1.33 22 10 51 33 SPXU 50% no 20 17 51 34 SPXU 50% 1.167 24 19 51 34 SPXU 75% no 17 11 49 33 SPXU 75% 1.25 23 14 50 33 SPXU Timed no 25 15 50 34 SPXU HalfTimed no 20 10 48 36 SPXU HalfTimed 1.33 28 13 49 36 An.Ret.: annualized return DD: max drawdown depth on rebalancing (it may be deeper intra-week) DL: max drawdown length K: Kelly criterion of the weekly game, an indicator of probabilistic robustness The ‘Timed’ version uses a signal based on the 3-month momentum of the aggregate S&P 500 EPS and the U.S. unemployment rate. ‘Half Timed’ means that 50% of the hedging position is permanent, the other 50% is timed. Among the 100% market neutral versions, shorting UPRO looks better at first sight… but it is not after taking into account the borrowing rate (4.48% last time I had a look at UPRO properties in InteractiveBrokers platform). As it represents 25% of the total portfolio, the drag on the portfolio annual return is about 1%, which gives the same performance as with SPXU. I prefer buying SPXU and eliminating the inherent risk of short selling. Moreover, U.S. tax-payers can implement this kind of strategy in an IRA account if they use SPXU. Such a portfolio can be traded without leverage, but cash and IRA accounts usually have a 3-day settlement period. It is recommended trading at a broker offering a limited margin IRA feature waiving the settlement period and the risk of free-riding. It seems that Interactive Brokers and TD Ameritrade do that (and maybe others). Inform yourself carefully. Data and charts: Portfolio123 Additional disclosure: Long SPXU as a hedge.
SPDR S&P 500 ETF : Let’s Analyze It Using Our Scorecard System

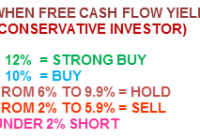
Summary Analysis of the components of the SPDR S&P 500 ETF (SPY) using my Scorecard System. Specifically written to assist those Seeking Alpha readers who are using my free cash flow system. Part II concentrated on “Main Street” while Part I in the series concentrated on “Wall Street” and this final Part III will combine everything into one final result. Back in late December I introduced my free cash flow “Scorecard” system here on Seeking Alpha, through a series of articles that you can view by going to my SA profile . My purpose in doing so was to try and teach as many investors as I could on how to do this simple analysis on their own as I believe in the following: “Give a person a fish and you feed them for a day, Teach a person to fish and you feed them for life” I have been very pleased with the positive feedback that I have received so far, but included in that feedback were many requests by those using my system, to see if they did their analysis correctly or not. Since the rate of these requests have been increasing with every new article I write, I have decided to start a new series of articles here on Seeking Alpha analyzing the SPDR S&P 500 ETF (NYSEARCA: SPY ), where I will analyze each of its components individually. That way those of you using my system will have something like a “teacher’s edition” that will give you all the correct calculations for each component. Obviously I couldn’t include the results for all my ratios in one article, so I will did a series of articles, (where this is the final part) where each ratio’s results for the SPDR S&P 500 ETF will have its own article devoted to it. Hopefully these articles can be used as reference guides that everyone can use over and over again, whenever the need arises. Having said that, I would suggest that everyone first read Part I by going HERE . There you will find the data on my “Free Cash Flow Yield” ratio which is one of three parts that I use it tabulating my final “Scorecard”. While free cash flow yield is a Wall Street ratio (Valuation Ratio), I also wrote an article that concentrated on my “CapFlow” and “FROIC” Ratios, which are Main Street ratios, which you can read by going HERE . In this article I will generate my Scorecard results for each component and basically combine all three ratio results to generate one final result. Once completed, my Scorecard should give everyone a clearer understanding on how accurate the valuation is that Wall Street has assigned each company relative to its actual Main Street performance. Before we show you the final results of my Scorecard, here is brief introduction to how it works: Scorecard The Scorecard is the final score for any company under analysis and this is done by combining the three ratio (listed below) final results into one analysis, we grade each company with either a passing score of 1 or a failing score of 0 per ratio where a perfect final score per stock would be a 3. The ideal CapFlow results are anything less than 33%. The ideal FROIC score is any result above 20%. The ideal Free Cash Flow Yield is anything over 10%. So in analyzing Apple (NASDAQ: AAPL ) for example, we get for TTM (trailing twelve months). For the conservative investor: CAPFLOW = 16% PASSED FROIC = 34% PASSED FREE CASH FLOW YIELD = 7.6% FAILED SCORECARD SCORE = 2 (Out of possible 3) For the aggressive or “Buy & Hold” investor, we get a Scorecard score of 3 as Apple’s 7.6% free cash flow yield would be classified as a buy. These are the parameters for the Free Cash Flow Yield. It is important before preceding to determine what kind of investor you are as determined by the amount of risk you are willing to take. Then once you have done that, then pick the parameter list below that fits your risk tolerance. So without further ado here are the final Scorecard results for the components that make up the SPDR S&P 500 ETF : What my Scorecard also achieves, besides telling you which individual stocks are attractive and which are not, is that it also allows you in “one shot” to see how overvalued or attractively valued the stock market is as a whole. For example, for the conservative investor now is the time to be extremely cautious as only these five stocks came in with a perfect score of “3” Affiliated Managers Group (NYSE: AMG ) Aflac (NYSE: AFL ) General Dynamics (NYSE: GD ) LyondellBasell Industries (NYSE: LYB ) Principal Financial (NYSE: PFG ) As you can see I only found 5 bargains out of 500 for the conservative low risk investor and that comes out to just 1% of the total universe being bargains! As for the aggressive investor, who is willing to take on more risk, we have only 30 stocks that are considered higher risk bargains. That comes out to only 6% being attractive and 94% being holds or sells. So as you can see as a portfolio manager I have to work extremely hard just to find one needle in the haystack, while in March 2009 there were probably 250 bargains for the conservative investor at that time. Thus this data clearly shows that we are at the opposite extreme of where we were in 2009 and are at an extremely overvalued level. Here is the same analysis using the Dow Jones Index where I actually analyzed that index for 2001, 2009 and 2015. You can view those results by going HERE . Here are also the 30 names that passed the “3” test for the more aggressive/buy & hold investor, from the list above. Affiliated Managers Group Aflac General Dynamics LyondellBasell Industries Principal Financial Accenture (NYSE: ACN ) Apple Bed Bath & Beyond (NASDAQ: BBBY ) Citrix Systems (NASDAQ: CTXS ) Coach (NYSE: COH ) CR Bard (NYSE: BCR ) Delta Air Lines (NYSE: DAL ) Dun & Bradstreet (NYSE: DNB ) Edwards Lifesciences (NYSE: EW ) Electronic Arts (NASDAQ: EA ) Expedia (NASDAQ: EXPE ) Fossil Group (NASDAQ: FOSL ) H&R Block (NYSE: HRB ) IBM (NYSE: IBM ) Lockheed Martin (NYSE: LMT ) Microsoft (NASDAQ: MSFT ) NetApp (NASDAQ: NTAP ) PetSmart (NASDAQ: PETM ) Qualcomm (NASDAQ: QCOM ) Rockwell Automation (NYSE: ROK ) Scripps Networks (NYSE: SNI ) Seagate Technology (NASDAQ: STX ) Teradata (NYSE: TDC ) VeriSign (NASDAQ: VRSN ) Western Digital (NASDAQ: WDC ) In getting back to the table the “TOTALS” you see at the end are the sum of each ratio divided by 500. The totals for both Scorecards are out of 1500 (1 point for each ratio result) as a perfect score were every stock would be a bargain. Therefore the conservative scorecard result is 384/1500 or 25.6% out of 100% and the more aggressive/buy & hold scorecard came in at 488/1500 or 32.5% out of 100%. Both clearly are not inspiring and could be a clear sign that the markets are ready for serious correction going forward. Always remember that the results shown above should not be considered investment advice, but just the results of the ratios. The system outlined in this article is just meant to be used as reference material to be included as just “one” part of everyone’s own due diligence. So in other words, don’t make investment decisions based on just my Scorecard results, but incorporate them as part of your own due diligence.

How To Design A Market Neutral Portfolio – Part 2

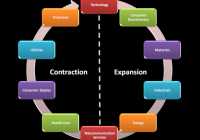
Summary Sector diversification is a key in market neutral investing. Two examples. Questions to solve for IRA compatibility. My previous article described the investor profile to hold a market neutral portfolio and some characteristics of this investing style illustrated by examples. I also explained why I prefer using an index ETF for the short side of the portfolio. In the next step, I want to focus on the benefit of sector diversification in market neutral investing. Sector diversification is especially important when the objective is to beat the benchmark in all market conditions, that is to say in all phases of the expansion-contraction cycle. The reality is more complicated than the figure. Cycles of different and variable periods may be in play, and macro trends can freeze the cycle for some sectors (like oil price does for energy and materials). In fact, it is sometimes quite difficult to figure out where we are and on which time frame when various cycles are combined. This is why, if an index ETF is on the short side, the long side of the portfolio must be diversified, not necessarily in all sectors, but at least in a few cyclical and defensive sectors. Since the return of such a Market Neutral Portfolio is the alpha of the long side, diversification in defensive and cyclical stocks is a key to keeping drawdowns acceptable in duration. In my opinion, the historical maximum duration in drawdown of an investing strategy is a parameter as important as the return and volatility. Examples I have performed a simulation of a portfolio mixing all the S&P 500 strategies of my book «The Lazy Fundamental Analyst» (Harriman House 2014). There are 9 strategies, one for each sector of the GICS classification, except Telecommunication (which is very small to elaborate statistical models). Each strategy selects 10 S&P 500 companies using a simple ranking process based on 2 fundamental factors. The factors are sector-dependent, chosen using historical statistics. The result is an equal-weighted portfolio of 90 stocks in a universe or 500, updated and rebalanced every 4 weeks. It is quite a big set (18% of the S&P 500 index) with various logics mixed, so the performance can hardly be suspected of being curve-fitted or random. Of course, past performance, real or simulated, is not a guarantee for future returns. But on such a portfolio it gives a good clue on the risk. The next chart shows the simulation of the 90-stock S&P 500 Lazy Portfolio (long side only) since 1999, with a 0.1% transaction cost and a 4-week rebalancing: (click to enlarge) The next table gives statistics of the excess return of the portfolio over the SPDR S&P 500 Trust ETF (NYSEARCA: SPY ) by 4-week periods, which corresponds to the market neutral portfolio with a leveraging factor 2, without the margin and carry cost for the “short half”. Average 4week return Average Annual return Max Drawdown Depth Max Drawdown Duration Avg gain / Avg loss 4week gain probability Kelly criterion Kelly crit. 95% confidence 0.94% 12.9% 20.5% 19 months 1.52 67% 0.46 0.35 Holding 90 stocks is a lot. In my real market neutral portfolio, I have reduced the number by: Excluding the most sensitive sectors to macroeconomic and geopolitical concerns: finance, energy and materials. My aim is not to get the best possible return, but a good return with a risk as low as possible. Optimizing the models to keep only 24 stocks with a diversification pattern, including at least 2 defensive sectors, 2 cyclical sectors and a minimum number of stocks in each of them. Optimizing to a lower number of stocks incurs a risk of curve fitting. However, with 24 holdings and various ranking logics, the risk remains quite low. The biggest danger of optimizing is not over-rating the possible return, but under-rating the real risk. In a diversified market neutral portfolio, the risk is limited by design. The next chart shows the simulation of my 24-stock portfolio (long side only) since 1999, with a 0.3% transaction cost and a 2-week rebalancing: (click to enlarge) This portfolio is more dynamic (rebalanced twice more often). It is also focused on large caps, but may hold a limited number of liquid small caps from the Russell 3000 index. Even if I use volume filters, I use a higher transaction cost to model a higher spread and slippage. The next table gives statistics of the excess return of the portfolio over SPY by 2-week periods, which corresponds to the market neutral portfolio leveraged twice, without the margin and carry cost. Average 2week return Average Annual return Max Drawdown Depth Max Drawdown Duration Avg gain/Avg loss 2week gain probability Kelly criterion Kelly crit. 95% confidence 0.79% 22% 11% 13 months 1.69 64.2% 0.43 0.36 These are examples. Ideas and steps can be reused with other quantitative models, or with a stock picking based on due diligence. The main idea here is to formalize and follow a sector-based diversification pattern. A next article will explain how to use leveraged ETFs to implement this strategy with a lower or no leverage (ProShares Ultra S&P 500 ETF (NYSEARCA: SSO ), ProShares UltraPro S&P 500 ETF (NYSEARCA: UPRO )), and the consequences of using inverse ETFs to avoid short selling (ProShares Short S&P 500 ETF (NYSEARCA: SH ), ProShares UltraShort S&P 500 ETF (NYSEARCA: SDS ), ProShares UltraPro Short S&P 500 ETF (NYSEARCA: SPXU )). Indeed market neutral investing can be implemented in an IRA account. Feel free to follow me if you don’t want to miss it. Data and charts: Portfolio123 Additional disclosure: Long SPXU as a hedge. Past performance is not a guarantee of future returns.