The ARBS See Crude Oil This Way
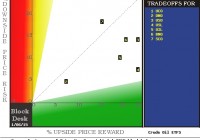
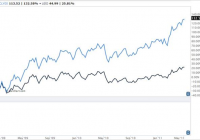
Summary The Arbitrage Community follows (is responsible for) the adages: “Those who talk don’t know; those who know don’t talk” and “Actions speak louder than words”. In the sequence of investing effects, commodities are often the initiators, equities are the derivatives – despite the terminology perspective of many investors, the media, lawyers and politicians. Economists could be (and occasionally are) the early-warning informers in this signal chain, but are inhibited by decades of historical modeling practices, looking largely backwards in time. Arbs provide a way around that trap when we observe and evaluate their actions in a context of rational, intelligent, informed expectation behavior norms. Everyone now knows Crude oil prices are down; what next? And lots of rational, after-the-fact explanations of the past are getting tiring. So also are the speculative opinions of many self-assertively-qualified “experts.” We all know where their mouths are, but where is their money? The money that may carry the most telling messages is in the price structures of markets that get used for hedging at-risk positions of organizations in the normal courses of business, where escape by inaction is not a viable choice. So they attempt to mitigate the anticipated problems by creating exchange-market transactions to their benefit IF their expectations eventuate. If they do not, well the “insurance” so bought is just another cost of doing business, and they are still well ahead of what their worst-case fears might have produced without the protection. Rational, intelligent, informed expectation behavior. The plus in this is that their actions push prices around in the financial markets as well as the spot commodity markets. All of these markets have spider-webs of interconnections transmitted from one to another by the monetary impacts of the hedging actions and the arbitrage opportunities created if those connections are not recognized. In dollar terms, the Financial markets are huge, compared to most commodities markets. But energy, its sources and uses, is pervasive in all occupied parts of the world, so it is the most significant commodity in active trading. The common denominator, its “reserve currency” in financial markets terms, is the (specifications-grade) barrel of Crude Oil. The immediate value influences on that crude barrel are availability and location. Commodity markets provide for availability with contracts for delivery at specific expiration dates. They provide for location at exchange-based delivery points, and the usual transportation costs from those points to other locations in the world are well-known and have their own markets that provide for changing circumstances in that dimension. So Crude is quoted as either West Texas Intermediate [WTI] at NYMEX-COMEX (US) contract specifications, or Brent (North Sea) at ICE Inter-continental Exchange specs for the rest of the world market. But either can be contracted for anywhere in the world and the local cost is quickly translated from the Exchange price. So what do these markets tell us about tomorrow? What makes it easier to handle is that much of the inter-market complexities are condensed into a few Exchange Traded Funds that focus on the commodity itself, not on the producers, refiners, or users of the products. Those commodity-based ETFs only have to identify, and differentiate on exchange base (WTI or Brent), spot (front month) delivery or later, and conventional long ownership or inverse (short position) pricing. Hedging using these ETFs simplifies the bets being made, and provides reliable stake-holders to ensure appropriate payoffs at any date that becomes appropriate for either side of the hedge, at prices provided by replacement stake-takers. Changing expectations by those potential replacements will be reflected in the bids and offers of the replacements. The reasoning behind the changing expectations may never be explained, but their extent and limits are revealed by yet another set of derivatives markets which provide hedging on the ETFs themselves. It is the changing of the price structures of these derivative markets that provide insights into tomorrow’s and next -week’s -months’ ETF prices. Once again, the behavioral analysis of the actions of rational, intelligent, informed market participants displays their expectations. Here is the ETF cast of characters: BNO United States Brent Oil ETF (NYSEARCA: BNO ) USO United States Oil ETF (NYSEARCA: USO ) OIL iPath S&P GSCI Crude Oil Trust ETN (NYSEARCA: OIL ) USL United States 12 Month Oil ETF (NYSEARCA: USL ) DNO United States Short Oil ETF (NYSEARCA: DNO ) SCO ProShares UltraShort Bloomberg Crude Oil ETF (NYSEARCA: SCO ) UCO ProShares Ultra Bloomberg Crude Oil ETF (NYSEARCA: UCO ) All but BNO are based on WTI-spec Crude. All but USL reflect spot or near-future-expiration price quotes. USL takes the rolling average of the next 12-months-expirations future price quotes. DNO and SCO reflect price changes inverse to the long-position price changes of other WTI Crude exchange prices. SCO and UCO are structurally organized to leverage their daily price changes to be double that of DNO or USO. At this point in time hedging in these ETFs imply coming upside likely price changes as indicated along the green horizontal scale of the Reward~Risk Tradeoff map below. Their average worst-case price drawdowns following similar prior forecasts form the other dimension of the tradeoff along the red horizontal scale, with the intersection of the two values marking the numbered ETFs in the blue field. Figure 1 (used with permission) This map compares the various Crude Oil ETFs in terms of an implied promise of an upside price change in the next few months to what typical price drawdown exposure has had to be endured in the past before reaching such a payoff. Cases above the diagonal line are where those pains have exceeded the promised gains. The short-position ETF DNO [2] has the least downside exposure history among current forecast alternatives, but also the least upside payoff prospect. Further upside gains of as much as +15% are indicated for SCO [7] because of its 2x leverage – over DNO’s +7% – but its risk cost is a lot more than 2x DNO’s -5%. USL [4] has lower risk than USO [3] – also without any leverage – because it is based on 12 months of future expirations in Crude futures rather than just the near month expiration. Brent Crude BNO [6] has less upside than USO [3] but as much risk exposure. Least attractive appears to be UCO [1] the leveraged long ETF. A couple of considerations are lacking in this simple map-based comparisons. What are the chances of any of these events actually taking place? How good is the information leading to these observations or expectations? The following table attempts to shed some light on such questions. It is in the same format used in our daily rankings of some 2,000+ stocks, ETFs, and market indexes. Figure 2 (click to enlarge) Of particular interest here should be the Win ODDS in column (8), the Credible Ratio in (13) and the Size of Sample in (12). These deal with qualitative considerations. Sample size (12) tells how many market days of the last 5 years (1261 total) had a similar forecast balance between upside and downside price change prospects as today’s forecast. Samples of less than a dozen are a bit dodgey in many cases. Extreme Range Indexes (7) of zero or less may be an exception. The Credible ratio (13) compares the upside promise of column (5) with the prior forecasts payoffs of (9) to test the current outlook’s believability. Win odds tell what proportion of the experiences of (12) netted in (9) were profitable. None of these should be taken as any guarantee. They are present to help the investor develop perspective. The blue average and totals lines at the bottom of the table provide comparisons of the table with those of the best of our population of alternative long investment prospects, the whole population’s averages, and the specifics for the S&P500 ETF (NYSEARCA: SPY ) as an index-tracking proxy alternative for the equity market. Recent forecast trends Figure 3 The continuing upsweep of expectations pictured in the vertical lines of DNO’s Block Trader Forecast [btf] picture encourage the impression that lower Crude prices are likely, at least in the near-term. The high Range Index of 63 in its historical distribution, and the average of only 18 days typical of holdings to reach top of forecast price range from this level are representative of momentum gains, unlikely to persist for months at a time. But the odds of a profitable experience are favorable in comparison with other Crude oil ETF alternatives. A check of DNO with our population’s better choices suggests that even better odds and markedly bigger payoffs and annual rates of return can be had. Perhaps this whole line of inquiry may not be very advantageous – except to avoid involvements in unfortunate coming investment results. This next btf might best be captioned “catch a falling chain-saw.” Figure 4 At some point a buyer of USL will be right. But prices and forecasts almost double today’s failed to note what Crude futures prices would be here only 6 months out from there. But neither did most other observers of the period. This ETF will be a much better choice when its forecast range vertical lines establish an uptrend that indicates some broad acceptance that a turn has come. Did the US export this problem? Figure 5 The problem is worldwide. Given Europe’s nightmare of eventual recognition that a common currency requires a common King or bureaucracy, breath-holding for demand recovery here is not advisable. The displacement of Saudi Arabian imports by North American expansion of tight oil production puts that lowest-cost oil into contention with all other world supply. The Saudis are making it clear that cost of production will be the supply~demand balancing factor, represented by price. Next? Richard Zeits’ most recent SA analysis of the supply side of that equation makes it very clear that the US and Canada have regained the position as the most influential change agents in providing supply at costs that are very competitive with many world producers using conventional production techniques. The North American producers have no reason to restrain their output as long as they are displacing imported oil, and they continue to expand their share of the world market by taking over supply of the North American market. Christoph Aublinger demonstrates in his SA neatly formatted articles that North American tight oil production has varying costs – as of the most comparable data, 2013 annual reports. But 2014 data is very likely to illustrate that known advances in extraction technologies will improve on those costs in most operations. The pressure on price from increasing North American supply will start to be augmented by other world producers learning the new techniques. The less able and those with control only of poorer deposits may be forced out of the picture at some level of crude price. But so will other world production, particularly those attempting to operate in high-risk environments, including parts of the mid-east, Africa, and various deep-ocean sites. Figure 5 The most profitable Crude Oil ETF has been SCO, the 2x leveraged short of the WTI price. Tripling in price in six months, it continues to be viewed optimistically by the Arbs. At some point it will prove to be overdone, and is in a stage now of momentum rather than of value. Its Range Index of 66 means that two-thirds of its prospective price range is to the downside. Additionally, net gains from prior Range Indexes at this level have been negative, at a -14% level, with only half of such opportunities becoming profitable within a 3 month time limit. Previous 66 RIs have been followed by -18% worst-case price drawdowns – not for the faint of heart. As a further caution, we only have a few examples of forecasts like the present. That is indicated by the red warning background in the data line of the btf above. Not much to rely on, but better than nothing. The three remaining ETFs have even more dismal pictures and data to present, and add little to the discussion. Their expectations and histories are shown in the table labeled Figure 2. Conclusion We are not optimistic that crude oil prices are yet done declining, nor that they will recover in the year 2015 to be much higher than they are at present, the $50-$60 area. Many treasured, “secure” defensive dividend payer individual stocks are likely to be unproductive investments this year. Returns from oilpatch investments in 2015 are likely to come mostly from specific speculations involving timing and resource discoveries. A summary of market-maker hedging for stocks in various energy sectors is in preparation and may be of interest.