RevenueShares Ultra Dividend Has Utility
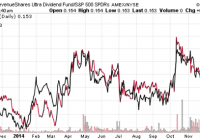
Summary RDIV has a relatively high yield compared to its nearest competitors such as DVY. RDIV takes the S&P 500 Index, pulls out the top 60 highest yielding stocks, and then weights them by revenues. RDIV’s strategy in the current market environment results in a very utilities heavy portfolio. RevenueShares takes a different approach to indexing. Instead of using the market capitalization approach to weighting index constituents, the firm uses a company’s share of revenues. RevenueShares takes an existing S&P index such as the S&P 500 Index and then applies the different weighting methodology. One of the main arguments against market capitalization weighted indexes is the valuation argument. As the price of a stock rises, so does its market cap, and over time a market cap weighted index becomes increasingly weighted towards overvalued shares. By using revenues as a weighting strategy, as a stock price rises faster than its revenue share, it is sold off at rebalancings. If a company’s stock price falls, but its revenues are steady or rise as a share of the index, it is purchased at each rebalancing. In other words, stocks that are overvalued by the price-to-sales metric are sold, and stocks that are undervalued by the price-to-sales ratio are purchased. RevenueShares has a dividend fund that uses this strategy: the RevenueShares Ultra Dividend ETF (NYSEARCA: RDIV ) . Index & Strategy As mentioned, RDIV weights the index by revenues. The index constituent universe is the S&P 500 Index. The field is narrowed to the top 60 stocks, ranked by the average 12-month trailing dividend yield. Holdings are then weighted by revenue. The result is a portfolio heavily overweight the top holdings in the modified index, as well as overweight the “defensive” sectors. The top 10 holdings are book-ended by Duke Energy (NYSE: DUK ) at the top, with a 5.07 percent weight as of January 26, and Kinder Morgan (NYSE: KMI ) at the bottom with 4.20 percent of assets. The top 10 holdings combine for 46.70 percent of assets. Utilities dominate sector exposure, with 39 percent of assets. The telecom sector is also overweight relative to the S&P 500 Index, at 17 percent of assets. Consumer staples and energy make up 16 percent and 13 percent of assets, respectively. Technology is almost non-existent at 0.19 percent of assets. Financials are very underweight relative to the S&P 500 at 4 percent of assets, and there’s no healthcare exposure. This makes for a very “defensive” portfolio whose performance currently lives and dies by the utilities sector. Performance RDIV’s inception date is October 2013. For much of this period, the utilities sector has performed very well and it was the best performing S&P 500 sector in 2014. The first chart here is the price ratio of RDIV versus the SPDR S&P 500 Trust ETF (NYSEARCA: SPY ) in red. In black, for comparison, is the price ratio of the Utilities Select Sector SPDR ETF (NYSEARCA: XLU ) versus SPY. The chart confirms what the sector exposure tells us: RDIV is highly influenced by the utilities sector. (click to enlarge) A dividend ETF with a similarly high concentration in utilities is the iShares Select Dividend ETF (NYSEARCA: DVY ), and the two funds fall into nearly the same section of Morningstar’s Stylebox: Large Cap Value. DVY falls on the line with the mid cap box and gets a Mid-Cap Value classification from Morningstar. The chart below shows the price ratio of RDIV to DVY, plus the price of the Industrial Select Sector SPDR ETF (NYSEARCA: XLI ). Industrials is the second largest sector in DVY. When industrials have rallied, RDIV trailed DVY, and vice versa. (click to enlarge) Finally, here’s a performance chart of RDIV, DVY, SDY and SPY since the inception of RDIV, showing that despite having different sector exposure, they’ve largely traded together. RDIV comes out on top thanks to it large utilities exposure. (click to enlarge) Expenses RDIV charges 0.49 percent. This is higher than DVY’s 0.39 percent and SDY’s 0.35 percent expense ratio. Income RDIV has a trailing 12-month yield of 3.26 percent. With only five quarters of dividend payments, it’s too early to evaluate the fund’s payout growth rate. The yield exceeds DVY’s 12-month trailing yield of 3.03 percent. Conclusion RDIV is a new fund that hasn’t found a large following yet, amassing only $52 million in assets in its first 15 months. The heavy weighting of the utility sector is an issue, but DVY has attracted nearly $16 billion in assets with nearly as much in the sector. Overall, the revenue weighting strategy shows a good track record and the yield on RDIV is competitive with the competition. Sector exposure won’t always lean in favor of utilities this much, but for the foreseeable future that’s likely to still be the case. Investors comfortable with that level of exposure can consider the fund as part of a dividend strategy. The main risk for the fund is the same for the utilities sector and dividend funds more generally. If interest rates stay low, investors will eventually bid up RDIV’s holdings until the yield gap with other dividend ETFs closes. If interest rates increase, the high debt utilities sector will come under pressure and investors will look beyond dividend shares to other income alternatives. Rates have come down substantially over the past couple of months though, so a major rebound will be required to take rates back to a level where they are competitive with stocks. The 30-year treasury yield was 2.40 percent as of January 26, down from 3.1 percent in November.

