Tag Archives: nysearcaoef

Weak Wages And Weaker Manufacturing, But How ‘Bout Those Rate Hike Expectations!

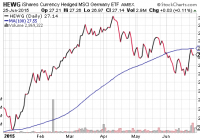
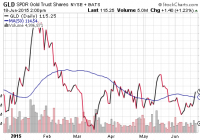
When half of the employed folks make less than what it takes to support one’s self, the wage growth required for a stronger economy cannot suddenly appear. Rather, increases in consumption must rely entirely on low-rate debt binging. Crafting a positive spin on the economy should not be a substitute for frank discussions on the actual state of affairs. I started working at the age of 13. I wanted to be productive. I wanted to make money. Gardener, golf caddy, food deliverer, waiter, bartender, entrepreneur, researcher, analyst, writer, planner, adviser, money manager – I probably spent as much time cursing and complaining as I did whistling. Nevertheless, thirty five years of work contributed to my well-being as well as the well-being of others. Will people from my generation (“Gen X”) leave the workforce anytime soon? Not if we intend to maintain our lifestyles. In fact, Gen Xers aren’t slated to begin retiring in earnest until 2030. We may have grown up as apathetic slackers, yet studies routinely demonstrate that those born between 1961 and 1981 are exceptionally industrious. (Good looking too.) So why are Gen Xers and post-World War II baby boomers leaving the workforce at an accelerated pace during this economic recovery? For example, today’s jobs report celebrated the creation of 223,000 new jobs in June and a 5.3% unemployment rate, while barely mentioning that 432,000 civilian workers disappeared from the labor force altogether. At present, a record 93.6 million of the U.S. working-aged population are no longer in the picture, resulting in the employment rate/participation rate hitting 1977 levels of 62.6%. It actually gets worse. There are roughly 100 million Americans out of 160 million Americans considered by the Bureau of Labor Statistics ( BLS ) as fully employed. Yet it has been estimated that 1/2 of those 100 million earn less than $15,000 annually as part-timers or self-employed workers. Should we really be declaring an annual income of $15,000 as sufficient for a spot in the full-time work column? Houston, we’ve got a problem. And I’m not even referring the planned layoffs across the oil and gas space. For one thing, when half of the employed folks make less than what it takes to support one’s self, let alone support children or elderly family members, the wage growth required for a stronger economy cannot suddenly appear; rather, increases in consumption must rely entirely on low-rate debt binging. Can you say, low rates for longer? Secondly, crafting a positive spin on the economy should not be a substitute for frank discussions on the actual state of affairs. Specifically, popular media outlets like the Associated Press have little business calling a tepid jobs report “solid.” In the absence of any month-over-month wage growth? In spite of downward revisions to job growth in prior months? With employment gains only keeping up with population gains? Indeed, the Associated Press even acknowledged that the employment rate/workforce participate rate fell because people out of work gave up on the pursuit and no longer count in the unemployed tally. How exactly is this a topnotch turn of events? There are two key ramifications of today’s data from the BLS as well as ancillary manufacturing data from the U.S. Census Bureau. First, the idea that the dollar can only move higher in light of China uncertainty and euro-zone complications is flawed. Expectations for the timing and the extent of rate hikes by the Fed continue to diminish with every lackluster economic presentation. Since the dollar had already priced in the end of quantitative easing in the U.S. and the eventual beginning of eurozone quantitative easing, I’m more inclined to expect the dollar via the PowerShares DB USD Bull ETF (NYSEARCA: UUP ) to end 2015 very near where it is today. Next, prominent sector investments like industrials and transports will continue to underperform. Simply stated, factory orders have fallen in nine out of the last 10 months; the seasonally adjusted year-over-year decline in factory orders is 6.3%. Strong dollar excuses notwithstanding, this type of data is entirely recessionary. In fact, it’d be difficult to find a period where the weakness in demand for U.S. manufactured goods was this low and it wasn’t associated with economic recession. As I have discussed on many prior occasions, one does not necessarily need to pare back core positions like the iShares S&P 100 ETF (NYSEARCA: OEF ). Not unless one is employing a disciplined approach to risk reduction . Still, if you have been holding onto an allocation to the Industrial Select Sector SPDR ETF (NYSEARCA: XLI ) or the iShares Transportation Average ETF (NYSEARCA: IYT ), consider taking profits. Technical analysis of the sectors suggest further erosion of price, and neither the BLS employment data nor the U.S. Census Bureau manufacturing data indicate a quick turnaround. Disclosure: Gary Gordon, MS, CFP is the president of Pacific Park Financial, Inc., a Registered Investment Adviser with the SEC. Gary Gordon, Pacific Park Financial, Inc, and/or its clients may hold positions in the ETFs, mutual funds, and/or any investment asset mentioned above. The commentary does not constitute individualized investment advice. The opinions offered herein are not personalized recommendations to buy, sell or hold securities. At times, issuers of exchange-traded products compensate Pacific Park Financial, Inc. or its subsidiaries for advertising at the ETF Expert web site. ETF Expert content is created independently of any advertising relationships.

The Risk Of Owning Stock Assets And Holding Stock Assets Right Now

Hold-n-hope advocates believe that greater gains with stocks over investment grade bonds require nothing more than a commitment to accepting increased volatility. At least during the bulk of the current century, one’s willingness to endure wacky stock price changes did not lead to enhanced results. Risk is not synonymous with price volatility, even though erratic price shifts do lead to a greater likelihood of losing money. Hold-n-hope advocates believe that greater gains with stocks over investment grade bonds require nothing more than a commitment to accepting increased volatility. In other words, if you accept the occasional craziness of stock prices, then your rewards will be far more robust than lower yielding debt instruments. But is that even accurate? In the 15-year period through 5/31/2015, stocks exhibited 4 times the amount of price vacillation (a.k.a. volatility) than bonds. Yet the S&P 500 SPDR Trust ETF (NYSEARCA: SPY ) provided annualized gains of 4.5% and the iShares Core Total U.S. Bond Market ETF (NYSEARCA: AGG ) produced annualized returns of 5.4% in the same time frame. At least during the bulk of the current century, one’s willingness to endure wacky stock price changes did not lead to enhanced results. The facts become even more revealing when one examines them in dollar terms. An investor who placed $250,000 in SPY on 6/1/2000 found the investment growing to $483,000 by 5/31/2015. He did not sleep particularly well during the dot-com bust, financial collapse or the euro-zone crisis, but he made progress with his account. Meanwhile, an investor who placed $250,000 in AGG on 6/1/2000 witnessed her investment growing to $550,000 by 5/31/2015. Her world never felt like it was coming to an end; she slept like a beloved house cat on a warm blanket. Risk represents the possibility of loss. Risk is not synonymous with price volatility, even though erratic price shifts do lead to a greater likelihood of losing money. It follows that many trumpet the idea that if you hold stocks long enough, you cannot lose money, let alone lose out to bond assets. Keep in mind, however, there are circumstances when stocks have struggled to break even over 65 years, 30 years as well as 15 years . Additionally, there are no guarantees that one will achieve a positive inflation-adjusted outcome over any time period. On the contrary. History suggests that when one pays an inordinate amount for the privilege of stock ownership, he/she would be fortunate to be “made whole” over 3, 5, 7 and 10 year periods. By nearly every measure of stock valuation, investors are already paying an inordinate amount for stocks. This alone implies that one might be setting himself/herself up for poor returns over the short- and intermediate-term. Let’s revisit the mistake that scores of investors made in June of 2000. They purchased stocks when price-to-earnings (P/E) and price-to-sales (P/S) ratios were higher than they had ever been beforehand. The result? An exceptionally rocky ride that produced little in the way of gain, and that’s if one had the fortitude to hold through thin and thick. Today, the P/E and P/S ratios for the median U.S. stock are higher than they were in June of 2000. So, then, what’s the probable result for buy-n-holders over the next 3, 5, 7 and 10 years? Even 15 years may be discouraging for those who pay today’s premium for ownership privileges. Granted, today’s 10-year yield is 2.38%. In June of 2000? 5.28%. The likelihood that bonds will outperform stocks over the next 15 years may be pretty darn slim. Over 10 years, however? With less risk of loss? Less volatility? In a buy-n-holder’s world, 2.4% on the 10-year may not be so ugly. My approach to the risks associated with owning and holding stocks at the current moment is to maintain cash/cash equivalents at 15%-20% for most of my client base. How did we move from roughly 70% growth/30% income to roughly 55%-60% growth/20%-25% income and a basket with cash/cash equivalents? Throughout the year, I reduced exposure to intermediate- and longer-term bonds; I had reduced the exposure to stock ETFs as well – stock ETFs like iShares Currency Hedged Germany (NYSEARCA: HEWG ) that had hit stop-limit loss orders and/or fallen below key trendlines. I will keep the 55%-60% growth allocation in funds like the Vanguard High Dividend Yield ETF (NYSEARCA: VYM ), the iShares S&P 100 ETF (NYSEARCA: OEF ) and the Health Care Select Sect SPDR ETF (NYSEARCA: XLV ), until those assets break below long-term moving averages or hit pre-determined stop-limit losses. And when cash is raised, the proceeds will be moved to money markets or shorter-term vehicles like the S PDR Nuveen Barclays Short-Term Municipal Bond ETF (NYSEARCA: SHM ). Why the combination of lower-risk equity positions, lower-risk bond positions and a higher cash allocation? Later or sooner, profitability and revenue shortfalls will weigh on equities. Later or sooner, borrowing cost increases will weigh on bonds and stocks. Most importantly, the best way to deal with sky-high valuations as well as the increased cost of capital is to keep more of the dollars that you already have. Is preservation sexy? No. Might it seem like a silly proposition over the next three months, six months, or one year? Perhaps. Looked at another way, though, selling overvalued assets higher offers one the opportunity to purchase fairly valued or undervalued assets lower. With current prospects for stock percentage returns sitting at 0% for three, five, seven and even 10 years, successful investors will prevail by making acquisitions after the proverbial fall. Disclosure: Gary Gordon, MS, CFP is the president of Pacific Park Financial, Inc., a Registered Investment Adviser with the SEC. Gary Gordon, Pacific Park Financial, Inc, and/or its clients may hold positions in the ETFs, mutual funds, and/or any investment asset mentioned above. The commentary does not constitute individualized investment advice. The opinions offered herein are not personalized recommendations to buy, sell or hold securities. At times, issuers of exchange-traded products compensate Pacific Park Financial, Inc. or its subsidiaries for advertising at the ETF Expert web site. ETF Expert content is created independently of any advertising relationships.

Allocating Assets When The Fed Talks Out Of Both Sides Of Its Mouth

One year ago, each of the 17 members of the Federal Reserve provided an expectation of where the fed funds rate would be at the end of 2015. The average came in at 1.1%. Here in mid-June, the average expectation for committee members for the end of the year now registers 0.45%. If the party is set to rage on, then, shouldn’t investors aggressively allocate dollars in U.S. equities? Not from my vantage point. One year ago, each of the 17 members of the Federal Reserve provided an expectation of where the fed funds rate would be at the end of 2015. The average came in at 1.1%. That might have required four to five rate hikes this year alone. By March, the expected year-end rate dropped to 0.65%. Perhaps two or three rate increases, then? Nope. Here in mid-June, the average expectation for committee members for the end of the year now registers 0.45%. The financial markets have even less conviction about a 2015 increase to the cost of borrowing. Investors via fed funds futures are only pricing in a 22% chance that the Federal Reserve raises the benchmark rate in September and a 62% probability of a rate liftoff at the central bank’s December meeting. Personally, I imagine one face-saving hike this year – a one-n-done to say that they did it. Nevertheless, nobody will be removing much of the alcoholic punch from the the party’s punch bowl anytime soon. Diminished expectations have not been confined to 2015 alone. Fed forecasts for year-end 2016 have dropped from roughly 1.9% to 1.6%. For 2017, they’ve moved down to 2.9% from 3.1%. And that’s not all that the Fed has downgraded. As recently as three months earlier, the institution anticipated 2015 economic growth at 2.3%-2.7%. Yesterday, committee members revealed an assessment of a lethargic 1.8% to 2.0%. Wait a second. Haven’t chairwoman Yellen and her colleagues been prattling on about economic acceleration since last year? Haven’t they been stressing transitory factors to explain every bit of weakness, while simultaneously pointing to improvements wherever they can be emphasized? With one side of its collective mouth, committee members are talking up the economy’s advances. With the other side, it currently believes that the economy will grow even slower than its post-recession growth rate of approximately 2.1%. Keep in mind, our 2.1% post-recession performance is historically weak under normal circumstances. Since 6/2009, though, America received $7.5 trillion in stimulus by the U.S. government; we received $3.75 trillion in electronic dollar equivalents by the Federal Reserve. In other words, unprecedented fireworks only enabled the economy to grow at a lethargic pace. Meanwhile, based on what the Fed members report outside of the media spotlight, they anticipate additional cooling off here in 2015 (circa 1.8%-2.0%). Is it any surprise that stocks would rocket on the probability of fewer anticipated rate hikes alongside a less vibrant economy ? Heck, the Fed successfully talked down the U.S. dollar, kept bond yields from extending their recent tantrum and sent the SPDR Gold Trust ETF (NYSEARCA: GLD ) back above 50-day moving average. If the party is set to rage on, then, shouldn’t investors aggressively allocate dollars in U.S. equities? Not from my vantage point. Successful investors tend to sell complacency, rather than purchase more of it. And “risk-on” investors have become incredibly complacent with respect to sky high valuations as well as Fed accommodation. Understand the real reason that the Fed is even talking about raising short-term rates at all. The monetary policy authorities need to bolster the Fed’s arsenal before the next recession, external shock and/or “black swan” event. They are no longer capable of moving from a 5% fed funds rate range down to 1% or 0%. Instead, we’re now talking about maybe – possibly, someday – getting up to 3% before going back to 0% rate policy and a 4th iteration of quantitative easing (“QE4”). In truth, I doubt that the Fed will ever be able to move beyond 1% before reversing course. Japan has spent the last 15 years stuck at 0.5% or less. That has everything to do with our reliance on zero percent rates and asset purchases with currency credits (“QE”) for six years. Japan made the same error in judgment. Admittedly, the Fed has been marvelously successful at persuading businesses to buy back their stock shares; they’ve convinced pensions, money managers, mutual funds and real estate investors to stay engaged, enhancing the “wealth effect” for the wealthiest among us. (Yes, that includes me.) On the other hand, I have seen the same excesses throughout the decades. I witnessed firsthand what happened to Taiwanese equities in 1986 when Taiwan R.O.C. opened its doors to outside investors. The irrationally exuberant run-up met its panicky demise the following year. I warned investors to have an exit approach to the insanity of dot-com euphoria in the late 1990s; I offered the same warnings leading up to the 2007-2009 financial collapse. In essence, you do not have to be sitting 100% in cash. We still remain invested in core positions such as the Vanguard Mid-Cap Value ETF (NYSEARCA: VOE ), the iShares S&P 100 ETF (NYSEARCA: OEF ) and the Vanguard High Dividend Yield ETF (NYSEARCA: VYM ). Yet we have also raised 10%-25% cash in our portfolios (depending on client risk tolerance) as stop-limit loss orders have hit on both bond and stock positions. We let go of energy investments that did not pan out. We stopped out of longer-term bonds earlier this year. And Germany via the iShares Currency Hedged MSCI Germany ETF (NYSEARCA: HEWG ) is no longer in the mix of any client. The result? More cash for future buying opportunities. And that buying opportunity is likely to be far more consequential than a 3% pullback. With only a few exceptions, we believe it is far more sensible to wait for the real deal – a 10%-plus correction and/or a 20%-plus bear. Disclosure: Gary Gordon, MS, CFP is the president of Pacific Park Financial, Inc., a Registered Investment Adviser with the SEC. Gary Gordon, Pacific Park Financial, Inc, and/or its clients may hold positions in the ETFs, mutual funds, and/or any investment asset mentioned above. The commentary does not constitute individualized investment advice. The opinions offered herein are not personalized recommendations to buy, sell or hold securities. At times, issuers of exchange-traded products compensate Pacific Park Financial, Inc. or its subsidiaries for advertising at the ETF Expert web site. ETF Expert content is created independently of any advertising relationships.