Tag Archives: nysearcajnk

Managed High Yield Plus Fund: A 9% Yield And A 12.5% Discount Is Hard To Resist

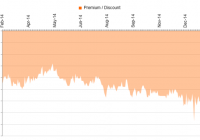
Investors are showing renewed interest in high-yielding junk bonds. With yields of government bonds near record lows, high yield bonds look increasingly attractive. Concerns about exposure to the energy sector appear overblown, especially as oil is now rebounding. Closed end funds offer some of the highest yields and still trade at significant discounts to net asset value. The Managed High Yield Plus Fund offers a rare combination of high yields and professional management, while trading at a major discount to net asset value. Managed High Yield Plus Fund (NYSE: HYF ) is a closed end fund or “CEF” that is professionally managed by UBS (NYSE: UBS ). It primarily invests in high yield bonds and offers a generous yield of nearly 9%. Besides the high yield, there are a couple of other compelling factors, including the fact that this fund pays the dividend on a monthly basis and it is trading at a historically wide discount of about 12.5%, to net asset value. The dividend also appears secure since this fund is earning more each month than it pays out. Let’s take a closer look: (click to enlarge) As the chart above shows, this closed end fund is currently trading for an exceptionally large discount to net asset value and one that is historically wide. The 3-year average discount to net asset value has been 5.78% and the 5-year average has been less than 2%. With the discount now at nearly 12.5%, this appears to be an exceptional buying opportunity. As of February 14, 2015, the net asset value is $2.18 per share and yet these shares are trading for just $1.91 per share. It’s worth noting that this fund has average earnings per share of about 1.37 cents per month, which clearly more than covers the monthly dividend it pays. That is important because it shows that the dividend is secure, and this reduces potential downside risks for investors. To see this and other information, you can see this fund data . This fund has around 359 holdings, which shows it is well-diversified. This diversification reduces potential downside risks for investors. Another consideration for bond investors is duration risk, however, this fund has an average maturity of just about 5.6 years, which means duration risks are low. This fund’s annual expense ratio of just 1.64%, which is low compared to many closed end funds. This fund pays a 1.35 cent per share dividend each month and the next payment is coming up soon. The dividend is payable on February 27th to shareholders of record as of February 19, 2015. The ex-dividend date is February 17, 2015. (click to enlarge) The SPDR Barclays High Yield Bond Fund (NYSEARCA: JNK ) is a popular way for investors to buy high yield bonds. As the chart above shows, junk bonds experienced a decline in mid-December over concerns that some energy companies could be more likely to default due to the plunge in oil prices. These concerns now appear overblown and oil has recently been trending higher. A Financial Times article points out that nearly $3 billion flowed into junk bond funds during the week of February 11, 2015 and this trend could be poised to continue, as the European Central Bank’s new bond buying program is creating more demand for high yield assets. A recent Bloomberg article details why investors are pouring back into junk bond funds, and that concerns over the plunge in oil are diminishing, it states : “Junk bonds are benefiting from demand for higher-yielding assets as the European Central Bank’s new round of bond purchases pushes yields on more than $1.7 trillion of debt worldwide below zero. The resurgence is sending down borrowing costs for speculative-grade borrowers and reopening a new-issue market that all but shut at the end of the year as oil tumbled below $45 a barrel from more than $107 in June. A rebound in crude has also boosted risk appetite. “With rates getting so low, you look at high-yield and it doesn’t look so bad,” Jack Flaherty, a money manager at New York-based GAM USA Inc., which oversees $17 billion, said in a telephone interview. “That has brought investors back in after the volatility at the end of last year scared them away. The fears from weak oil, while not gone, have lessened.” For all the reasons mentioned above, it makes sense to consider this fund if you are seeking generous yields, a monthly payout that is well-covered by current earnings, and professional management. The discount of nearly 12.5% to net asset value is an added bonus because if the discount narrows back to more historical levels, investors could also be positioned for significant capital gains. Here are some key points for the Managed High Yield Plus Fund, Inc.: Current share price: $1.92 The 52 week range is $1.75 to $2.19 Annual dividend: 16 cents per share (or 1.35 cents per month), which yields about 9% Data is sourced from Yahoo Finance. No guarantees or representations are made. Hawkinvest is not a registered investment advisor and does not provide specific investment advice. The information is for informational purposes only. You should always consult a financial advisor. Disclosure: The author is long HYF. (More…) The author wrote this article themselves, and it expresses their own opinions. The author is not receiving compensation for it (other than from Seeking Alpha). The author has no business relationship with any company whose stock is mentioned in this article.
6 High-Yield Bond CEFs Trump ETFs Like HYG And JNK

Summary After a late 2014 sell-off, high yield bond funds currently offer very attractive mid- to high single-digit yields. Though they contain significant exposure to credit risk, high yield bonds have a relatively low sensitivity to rising interest rates. Investors interested in ETFs like HYG or JNK should consider the more than 30 closed-end funds that focus on high yield debt. Because of their unique structure, closed-end bond funds are able to generate substantially higher distribution income, sometimes with less credit or interest rate risk. High-Yield Bonds can be an important addition to a diversified taxable income-seeking portfolio, generating significant yields with less interest rate risk than alternatives including government or investment grade corporate funds. Accordingly, leading High-Yield Bond ETFs like SPDR Barclays Capital High Yield Bond ETF (NYSEARCA: JNK ) and iShares iBoxx $ High Yield Corporate Bond ETF (NYSEARCA: HYG ) have accumulated combined assets of more than $24 billion. However, investors – especially individual investors – in JNK and HYG should consider the closed-end fund alternatives for high yield bond income. This article will examine six closed-end funds that specialize in high yield bonds that provide superior yields with a similar risk profile. For an in-depth examination of the risks and rewards of high yield bond CEFs please refer to “In Search of Income: High Yield Bond CEFs Part I & Part II . Understanding the Closed-End Fund Structure Closed-End Funds (CEFs) are a form of mutual funds that have existed in the United States since 1893. While CEFs are actually the “original” type of mutual fund traded on US exchanges, they are far less common than the “open-ended” type of mutual funds that most investors associate with the term “mutual fund”. CEFs represent less than 2% ($298 billion) of the $15 trillion mutual fund market. CEFs are used for a variety of active strategies in both the equity and fixed income categories, and are most commonly associated with income generating strategies such as high yield bond investing. The closed-end fund structure is unique among market-listed fund structures because of its combination of three characteristics: Permanent capital – CEFs issue a fixed number of shares at IPO and do not subsequently create or redeem shares except in rare instances. This provides fund managers with permanent capital that is not subject to the whims of investor redemption requests. Continuous trading / market pricing – investors that want to transact shares of a CEF do so on the open market at any point during trading hours, buying from and selling to other individual market participants. Importantly, this leads to the existence of divergences between share price and share value NAV. Use of Leverage – CEFs frequently choose to use moderate amounts of leverage to enhance returns on investor capital. While this does also increase risk and volatility, this leverage can be attractive to investors because borrowing costs required to support it tend to be much lower than any alternative source of leverage financing accessible to individual investors. Closed-end funds and Exchange-Traded Funds are often compared to mutual funds because each type often focuses on a particular sector of the market. Perhaps because the mutual fund industry historically enjoyed high fees, sales loads and profitability the exchanged traded funds focusing on similar sectors have grown in popularity. However, the Closed-End Fund segment is often overlooked for investors interested in a specific sector. Advantages vs. ETFs – Exchange traded funds have exploded in popularity in the past two decades in part because they are exceptionally cost/tax efficient ways to get exposure to certain passive strategies. However, the CEF structure has several advantages over ETFs when investing in segments such as high yield debt. First, CEFs are actively managed, enabling seasoned fixed income portfolio managers to select specific attractive bond issues rather than “buying the market” as an index fund does. Second, CEFs have permanent capital not subject to redemptions which is of particular importance in sectors like high yield debt, where herd mentality can lead to investor redemptions at precisely the moment when bonds are least easily sold, and can make it hardest for ETF managers to “be greedy when the market is fearful”. CEF managers have ability to ride out – and capitalize on – these panics. Third, CEFs are able to employ low-cost leverage to enhance returns. Finally, because CEFs trade a prices significantly different (and typically lower) than their net asset values, savvy investors have opportunity to earn greater yields (earn the income on $100 of bonds with only $90 of investment) as well as potential for capital appreciation. Advantages vs. Mutual Funds – Standard Mutual funds, technically classified as “open-end mutual funds”, offer tremendous variety of both active and passive strategies. However, closed-end funds have several advantages on them as well. In addition to the permanent capital, leverage, and discount pricing described above, CEFs offer continuous liquidity and the ability to control price at which you buy and sell with limit orders, rather than once daily trading after market hours at “blind” prices. Comparing Investment Options With those structural differences in mind, we’ll compare two of the largest high yield bond ETFs, iShares iBoxx $ High Yield Corporate Bond ETF and SPDR Barclays Capital High Yield Bond ETF , to six leading high yield closed-end funds ( AWF , GHY , HIO , IVH , NHS , and HYI ). While the selected funds represent only 6 of 33 CEFs in the High Yield category, they provide a good cross-section of fund sponsors, sizes, and risk metrics. (click to enlarge) Income Generation The principal motivation for owning high yield bond funds is, unsurprisingly, high yield. Many high-yield ETF investors may be surprised to find that CEF offerings in the High Yield Bond segment offer substantially higher risk adjusted yields than their ETF counterparts. While there are many factors to consider in comparing the opportunities and risks presented by ETFs and CEFs, the 250+ basis point difference in yield is hard to ignore. (click to enlarge) Note that, because they are actively managed, closed-end fund distributions at times the include return of capital, long-term capital gains or short-term capital gains. However, for the funds we are examining, those factors are virtually insignificant, as shown in the below table. (click to enlarge) Price to Value (aka the closed-end discount) As mentioned above, a core feature of closed-end funds is their tendency to trade at prices that vary considerably from their underlying value, or NAV. This difference is commonly referred to as the premium (or discount) to NAV. When prices are below NAV (which historically has been the case about 90% of the time), the discounts created create two major advantages for CEF investors. First, purchasing at a discount enhances yields since an investor can own the rights to the income generated from a hypothetical $10 of net assets with only $9 of investment. Second, for investors willing to actively manage their holdings, funds purchased at particularly wide discounts can be sold at narrower discounts – or even premiums – for capital gain treatment that enhance the after tax returns from a fund. High yield bond CEF discounts are currently in the 10% range, though wide variation exists. ETFs rarely have meaningful or sustained discounts to NAV. (click to enlarge) Risks Return potential from an investment must be viewed in the context of the risk investors are taking. Bond investors are primarily exposed to two types of risk: (1) default risk, as measured by credit rating, and (2) interest rate risk, as measured by “duration”. The high yield bond sector generally carries moderate to high default risk (the “junk” in junk bonds…) but tend to have low durations, and thus low interest rate risks. As many investors are concerned about the specter of interest rate increases, the shorter duration of all funds – CEF and ETF alike – in the category is attractive to many. Comparing across funds, CEFs are generally equivalent on credit rating and superior on duration, in many cases even when the amplification effect of leverage is considered. (click to enlarge) Expenses Because CEFS are actively managed, adjusted expense ratios typically exceed ETFs by 50-100 basis points. While index ETF fees are 0.4 to 0.5%, CEFs range from a little less than 1% to little more than 1.5%, after adjustment for cost of leverage. (click to enlarge) * According to Morningstar: “By regulation, closed-end funds utilizing debt for leverage must report their interest expense as part of expense ratio. This happens even if the leverage is profitable. Funds utilizing preferred shares or non-1940 Act leverage are not required to report the cost of leverage as part of expense ratio. To make useful comparison between closed-end funds and with both open-end funds and exchange-traded funds, the adjusted expense ratio excludes internal expense from the calculation. In addition, we adjust the calculation’s denominator, basing it on average daily net assets.” Conclusion The high yield bond sector is interesting at current – regardless of investment vehicle chosen – because of its relative lack of interest rate risk and its recent re-pricing in response to the falling price of oil. Investors considering high yield ETFs should give a close look at the CEF alternatives, primarily for the enhanced income distributions and secondarily for the potential gain from a narrowing price discount.

Under The Hood Of SPDR Barclays High Yield Bond ETF

By John Gabriel For strategic, long-term exposure to U.S. high-yield bonds, investors may consider SPDR Barclays High Yield Bond ETF (NYSEARCA: JNK ) as a small core holding. The fund can also serve as a tactical investment for the satellite portion of a diversified portfolio. Investors should bear in mind that high-yield bonds are one of the most volatile sectors of the fixed-income market. Long-term-minded investors looking to JNK as a strategic position are likely to find the diversification benefits of high-yield bonds attractive. High-yield bonds tend to be negatively correlated (or uncorrelated) with government and aggregate bond portfolios, which often make up the bulk of most investors’ fixed-income exposure. Moreover, high-yield bonds are poised to hold up relatively well in the event of rising interest rates and inflation. While rising rates and inflation tend to be the enemy of typical fixed-income securities, the high-yield bond asset class tends to outperform its fixed-income peers during such periods thanks to its stocklike returns and heavier dependence on business fundamentals. Consider that over the past 10 years, U.S. high-yield bonds have shown positive correlation (74%) with the S&P 500, while the Barclays U.S. Aggregate Bond Index has been relatively uncorrelated (26%) over the same period. Remember, interest rates will typically rise when the economy is in good shape and businesses are performing well. High-yield bonds tend to perform well when issuers’ fundamentals are strong or improving (and vice versa). Tactical investors may look to a fund like JNK as a way to bolster income in a yield-starved environment. However, investors should not look at the fund’s yield in isolation. Rather, the current yield should be viewed in relation to the yield offered by U.S. Treasuries with the same maturity. The difference between the two is what is known as the credit spread, and it represents the premium that investors can collect for assuming additional credit risk. The credit spread should also be viewed relative to the expected default rate. According to Moody’s, since 1983 the historical average default rate for high-yield bonds is 4.8%. In the trailing 12-month period through October 2014, the U.S. high-yield default rate was 2.4%, relatively flat from a year ago. Rising default rates typically result in widening credit spreads. But default rates are expected to remain low (around 2%) thanks to favorable credit conditions. Fundamental View The U.S. high-yield bond market has evolved over the past few decades. Whereas in the 1970s the overwhelming majority of high-yield bonds were so-called “fallen angels” (bonds issued by companies that had their credit ratings downgraded from investment-grade to high-yield status), today there is a vibrant and healthy market for new-issue high-yield bonds. According to SIFMA, in 2014, new issuance of high-yield bonds in the United States was $278 billion through October, slightly below the $285 billion sold in 2013 in the same period. By comparison, high-yield issuance averaged $95 billion per year from 1999 to 2009. Many investors may find the significant income potential of U.S. high-yield bonds attractive, particularly in the current low-yield environment. Their income potential is a primary point of appeal that attracts investors to the high-yield corporate-bond market. Indeed, there are very few other investments that offer high- to mid-single-digit yield potential in the current market environment. But other factors to consider include the asset class’ diversification benefits as well as its ability to withstand the impact of rising interest rates, potential inflation, and an uptick in the instance of default. U.S. high-yield bonds offer a favorable risk/reward profile relative to other major asset classes thanks to their equitylike returns with significantly less volatility. Owing to its generous yield, the Bank of America Merrill Lynch High Yield Master II Index (the generally accepted benchmark for the asset class) generated an annualized total return of 7.6% over the past 15 years. This compares to a total return of about 4.6% for the S&P 500. But the BofAML HY Master II Index’s annual standard deviation over that period was 9.9%, compared with 15.3% for the S&P 500. Adding a stake in high-yield bonds to complement aggregate bond exposure can help improve a portfolio’s diversification benefits. In fact, over the past five years, high-yield bonds have been uncorrelated (12%) with the Barclays U.S. Aggregate Bond Index. The asset class’s lack of correlation with investment-grade bonds and its negative correlation with government bonds should be an advantage when we finally see the inevitable rise in interest rates and potentially higher inflation. Of course, these advantages don’t come without risk. This economically sensitive asset class fell more than 32% in 2008 when the markets were roiled by the global credit crisis. Steady inflows from yield-starved investors have helped drive prices higher. The current option-adjusted credit spread between the BofAML HY Master II Index and U.S. Treasuries is about 4.4%. For some context, consider that the long-term average credit spread is about 6%. The all-time low of around 2.5% occurred in June 2007, while the all-time high occurred in December 2008 at the height of the credit crisis when the spread briefly spiked up to more than 20%. Fitch expects U.S. high-yield default rates will remain low through 2015 thanks to accommodative funding conditions and a recovering economy. Moreover, many of the highest risk issuers have taken advantage of favorable credit markets in recent years to extend their lifelines. Portfolio Construction This fund seeks to provide investment results that, before fees and expenses, correspond generally to the price and yield performance of the Barclays Capital High Yield Very Liquid Index. The index includes publicly issued U.S. dollar-denominated, non-investment-grade, fixed-rate, taxable corporate bonds that have a remaining maturity of at least one year. The fund uses a representative sampling strategy to track the index and currently has nearly 800 holdings. Its sector exposure is extremely concentrated, as industrials make up 89% of the portfolio. The financials sector makes up roughly 8%, while utilities round out the portfolio at about 4% of the benchmark. Issues rated BB and B make up 40% and 43% of the index, respectively. The remaining 17% is made up of issues rated CCC or lower. Currently, the fund’s modified adjusted duration is 4.38 years, and its weighted average yield to maturity is 6.39%. Fees This fund charges an expense ratio of 0.40% per annum. While this is quite a bit higher than those levied by funds tracking an aggregate bond index, it is cheap compared with actively managed funds in the same category. High-yield bonds tend to be more illiquid than investment-grade corporate bonds, which can make them comparatively expensive to trade. With an estimated holding cost of 0.72%, JNK reflects the challenges of employing a sampling strategy to track a relatively illiquid benchmark. Transaction costs explain the difference between the fund’s expense ratio and its estimated holding cost. Alternatives The closest alternative to JNK is iShares iBoxx $ High Yield Corporate Bond (NYSEARCA: HYG ) , which has a slightly higher expense ratio of 0.50% but a lower estimated holding cost of just 0.18%. HYG tracks the Markit iBoxx USD Liquid High Yield Index and also employs a representative sampling strategy. It currently has nearly 900 holdings and is much more diversified than JNK in terms of sector exposure. At 4.12 years, it has a slightly shorter duration than JNK. It also has a lower average yield to maturity of 5.59%. Another alternative for investors to consider is PowerShares Fundamental High Yield Corporate Bond ETF (NYSEARCA: PHB ) , which charges a 0.50% expense ratio. PHB seeks to outperform its cap-weighted peers by tracking a fundamental index developed by Research Affiliates, LLC. Investors concerned about the health of the economy and future default rates may favor PowerShares’ PHB, as its benchmark avoids the riskiest issuers (excludes issues rated below B). PHB has a comparable duration of 4.37 years, and its higher-quality portfolio offers a slightly lower yield to maturity of 5.05%. Investors concerned about the impact of rising interest rates may consider SPDR Barclays Short Term High Yield Bond ETF (NYSEARCA: SJNK ) or PIMCO 0-5 Year High Yield Corporate Bond ETF (NYSEARCA: HYS ) , which charge expense ratios of 0.40% and 0.55%, respectively. SJNK currently has a modified duration of 2.4 years, and its yield to maturity is 6.41%. HYS has a slightly lower duration of 1.96 years and currently offers an estimated yield to maturity of 5.47%. Disclosure: Morningstar, Inc. licenses its indexes to institutions for a variety of reasons, including the creation of investment products and the benchmarking of existing products. When licensing indexes for the creation or benchmarking of investment products, Morningstar receives fees that are mainly based on fund assets under management. As of Sept. 30, 2012, AlphaPro Management, BlackRock Asset Management, First Asset, First Trust, Invesco, Merrill Lynch, Northern Trust, Nuveen, and Van Eck license one or more Morningstar indexes for this purpose. These investment products are not sponsored, issued, marketed, or sold by Morningstar. Morningstar does not make any representation regarding the advisability of investing in any investment product based on or benchmarked against a Morningstar index.