Tag Archives: nysearcaiwv

Total Stock Market ETF Showdown

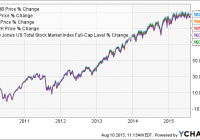
Summary A low expense total market ETF ought to be the cornerstone of a well-diversified portfolio. I will compare several well-known ETFs and ultimately make a recommendation. I will make a comparison on these metrics: expense, # of holdings, volume, yield, historical performance, and correlation. Introduction As a long term investor, I believe a low expense total stock market ETF should be a core holding in a diversified portfolio. Total stock market ETFs are designed to passively track the entire market by maintaining a large basket of small, mid, and large cap equities. These ETFs mitigate single stock risk and generally provide attractive dividends. Total stock market ETFs are invaluable for providing investors with exposure to strong equities within sectors they may not understand well. The best ETFs have low expense ratios (as to not siphon of long-term returns), and hold a well-weighted, liquid, basket of equities. ETF Contenders The Four ETFs I will compare are as follows: the Vanguard Total Stock Market ETF (NYSEARCA: VTI ), the Charles Schwab U.S. Broad Market ETF (NYSEARCA: SCHB ), the iShares Russell 3000 ETF (NYSEARCA: IWV ), and the SPDR Russell 3000 ETF (NYSEARCA: THRK ). Historical Correlation For an ETF like this, you want to see a long term correlation between the total market and historical returns. If this was a short term play (a leverage ETF, ETN, Ect.) I would go more in depth. In this case I graphed out 10 years of past performance (% change), and each ETF appears adequately correlated. SCHB and VTI appear to have the best total returns, and perhaps they are weighted the best (or most aggressively). Comparing Key Metrics Total Market – Key Metrics VTI SCHB IWV THRK Total Assets 56.22 Bil 4.99 Bil 6.24 Bil 248.92 Mil # of Holdings 3,814 2,018 3,008 2,509 P/E Ratio 21.7 X 19.3 X 19.97 X 17.70 X Avg. Volume 2.7 Mil 518,431 252,213 18,437 Expense 0.05% 0.04% 0.20% 0.10% SEC Yield 1.88% 1.81% 1.69% 1.77% Biggest Concern The aforementioned P/E ratios paint a larger picture of the overall market. The averaged out P/E multiple for the market is roughly 20X which indicates the market may be moving towards “overvalued” territory. I wrote previously that overall market returns average about 10% annually, but they also range from 5%-18% annually (averaged over a 20 year time frame). While returns over the last 5 years have been close to 12% annually, they may taper off to the lower range of historical returns. There could even be a short-term market correction. For this reason, I want to reiterate the importance of maintaining a long term horizon. Side note, it may soon become difficult to find opportunities for significant capital appreciation going forward. THRK The SPDR Russell 3000 ETF is the smallest of the four ETFs. THRK is not the cheapest, and it does not have as much liquidity as other options. Its small asset base is not optimal in comparison to relevant alternatives. THRK needs to grow to compete with iShares, Schwab, and Vanguard. IWV The iShares Russell 3000 has the highest expense ratio, but it does have some notable characteristics that differentiate it. IWV has unbiased exposure and large number of holdings. IWV additionally maintains a large percentage of small-cap stocks that gives it increased diversification and risk/reward. IWV’s low yield and low comparable liquidity, however, makes me believe their are better options. SCHB The Schwab U.S. Broad Market ETF is the cheapest option on the market (0.04%). It offers an attractive 1.81% SEC yield, but it excludes a number of micro-caps (decreasing reward and diversification benefits). It is very liquid, but not the most liquid, and SCHB holds the fewest equities of all four ETFs. VTI The Vanguard Total Stock Market ETF is the most traded of the four ETFs. VTI has the most AUM and a micro expense ratio (0.05% only 0.1% more than SCHB). Additionally, VTI holds the largest basket of equities giving it broad diversification and optimal market exposure. VTI currently has the highest SEC yield as well (1.88%). Recommendation I believe VTI and SCHB are the two best total market ETFs on the market. Of those two, I believe VTI is slightly better than SCHB because is provides more total market exposure and more liquidity. I would recommend a long position in VTI. I would also establish a dividend reinvestment plan (if possible) to increase the compounding effect over time. Disclosure: I/we have no positions in any stocks mentioned, and no plans to initiate any positions within the next 72 hours. (More…) I wrote this article myself, and it expresses my own opinions. I am not receiving compensation for it (other than from Seeking Alpha). I have no business relationship with any company whose stock is mentioned in this article.
My Favorite Low Fee ETFs And Mutual Funds For Domestic Equity

Summary Investors should be comparing several options when picking the ETFs or mutual funds they want to use. I’ve collected several of the ETFs that I think are very strong contenders for best of breed status. These ETFs tend to have low expense ratios and offer very diversified domestic exposure. I’m concerned that the market prices are relatively high. While I expect long term prices to go up, I want to protect against short term weakness. Because I’m concerned about weakness in the market, I see SCHD as a top contender among equity non-REIT investments in the domestic market. One of the areas I frequently cover is ETFs. I’ve been a large proponent of investors holding the core of their portfolio in high quality ETFs with very low expense ratios. The same argument can be made for passive mutual funds with very low expense ratios, though there are fewer of those. In this argument I’m doing a quick comparison of several of the ETFs I have covered and explaining what I like and don’t like about each in the current environment. By covering several of these ETFs in the same article I hope to provide some clarity on the relative attractiveness of the ETFs. One reason investors may struggle to reconcile positions is that investments must be compared on a relative basis and the market is constantly changing which will increase and decrease the relative attractiveness. For investors that want to see precisely which assets I’m holding, I opened my portfolio about a week ago. The ETFs (and two mutual funds) I want to cover are indicated below. ETFs and mutual funds for consideration Vanguard Total Stock Market ETF (NYSEARCA: VTI ) Fidelity Spartan® Total Market Index Fund (MUTF: FSTVX ) –I am long every investment above this line– Schwab U.S. Broad Market ETF (NYSEARCA: SCHB ) iShares Russell 3000 ETF (NYSEARCA: IWV ) Schwab U.S. Dividend Equity ETF (NYSEARCA: SCHD ) Vanguard Dividend Appreciation ETF (NYSEARCA: VIG ) When I’m contemplating investing in an ETF, I don’t want to buy a short term holding. At heart, I am a buy and hold investor that is willing to sell most investments only when I become sufficiently bearish. I generally handle rebalancing slowly through allocating new investments to the asset class that needs more strength. However, I don’t rebalance to exact ratios. I follow general rules for the allocation but within reasonable boundaries I will overweight or underweight sectors based on their relative attractiveness. When the market appears overvalued across the board, I reduce my rate of purchase. I still dollar cost into major indexes and I still will allocate some new funds, however I’m also more willing to spend money on doing major projects around the house rather than adding to my investment portfolio. I don’t cut off purchases entirely because I believe the markets will trend to move upwards over time by at least the rate of inflation, which will be much higher than my savings account will pay. Currently I consider the market to be slightly overvalued. Not as overvalued as it was before Greece (which I consider overblown), but the high P/E ratios make domestic investment riskier and the high correlations of international markets combined with the problems in Greece and the problems I expect in China make me concerned about short term international performance. Total and Broad Market VTI and SCHB are total and broad market ETFs. They have a correlation running 99% or higher on returns, so I consider them to be interchangeable. The same can be said for FSTVX though it is a mutual fund. I use mutual funds for an employer sponsored retirement account that is limited to investment in certain mutual funds. I consider these investments to be the best of breed for investors seeking exposure to the total or broad U.S. equity market. Despite my very high opinion of these investments, I feel the market is pushing on being valued too highly and see potential for problems with increases in interest rates expected in September. I’m expecting to see an increase in inflation over the next year or so with higher velocity of money and an increase in inflation may reinforce the decision to slightly increase rates. IWV holds very similar investments and also has very high correlation to the other ETFs listed here, but I expect it to outperform the other options over the long term because of a higher expense ratio. When the assets are very similar, I expect the expense ratios to be a significant factor in the relative performance. Dividend Focused (non-REITs) One of my favorite dividend investments is the Schwab U.S. Dividend Equity ETF. I expect it is one area where I’ll be adding some cash over the rest of the year. SCHD offers an extremely low expense ratio and free trading in Schwab accounts make it an ideal way for an investor to add incremental small levels of exposure. Large cap companies with solid dividends have shown some relative strength in corrections historically and I see the potential for that trend to continue. Aside from funds going into FSTVX for dollar cost averaging, SCHD is easily the strongest contender for receiving additional investments. I’m not long SCHD yet, but I expect to be long on it later this year. Lately SCHD has been weaker than the broad market ETFs, but I think the difference in performance reflects a bullish view by the market. Another solid option for investors wanting diversification in their dividend growth investments is VIG. In my personal rankings VIG has to come below SCHD due to a meaningfully higher expense ratio and a lack of free trading in my accounts. For investors using accounts that have free trading on VIG, it would make more sense for small incremental additions to the portfolio to use VIG rather than SCHD. Conclusion I believe I have selected several best of breed ETFs for investment in the domestic equity market, but I’m becoming less bullish due to high P/E ratios, historically high earnings relative to GDP (raising the denominator in the P/E ratio), and the potential for higher interest rates combined with inflation. While equities do serve as a decent hedge against low rates of inflation, I would be compelled to buy inflation adjusted bonds if they had decent yields. I believe there are plenty of other investors that would also like to be holding more bonds for risk reduction and if decent yields become available I expect it will weigh on stock prices as investors adjust allocations. Some investors may feel that such a situation would hurt dividend stocks and thus dividend ETFs more than other sectors. I’ll take the risks there because a little weakness from raising rates is acceptable to me in exchange for having investments that may not fall as hard if the situation with China and Greece starts hitting the U.S. equity market harder. Disclosure: I am/we are long VTI, FSTVX. (More…) I wrote this article myself, and it expresses my own opinions. I am not receiving compensation for it (other than from Seeking Alpha). I have no business relationship with any company whose stock is mentioned in this article. Additional disclosure: Information in this article represents the opinion of the analyst. All statements are represented as opinions, rather than facts, and should not be construed as advice to buy or sell a security. Ratings of “outperform” and “underperform” reflect the analyst’s estimation of a divergence between the market value for a security and the price that would be appropriate given the potential for risks and returns relative to other securities. The analyst does not know your particular objectives for returns or constraints upon investing. All investors are encouraged to do their own research before making any investment decision. Information is regularly obtained from Yahoo Finance, Google Finance, and SEC Database. If Yahoo, Google, or the SEC database contained faulty or old information it could be incorporated into my analysis.