Tag Archives: nysearcaiwm

The SEC Is Going Too Far On ‘Clawback’

Summary Andrew Ross Sorkin of DealBook reported that the new SEC proposal could obligate all publicly traded companies to recover incentive-based compensation from executives contingent on certain events. If the proposal is passed, it would result in widespread ramifications for Corporate America. In this piece, I detail the potential negative consequences that I believe are the most salient to the discussion at hand. Ramifications would revolve around the misalignment of interests between shareholders and management. Increased compliance costs and reduced market liquidity would be possible consequences as well. Investors should consider allocating capital to international corporations not subject to SEC regulation. “Clawbacks” are coming Recently, New York Times DealBook founder Andrew Ross Sorkin reported that the Dodd-Frank regulation, which aims to overhaul the financial system post-2008 requires the Securities & Exchange Commission to devise a rule relating to “clawbacks”. As a quick reminder to readers who are not familiar with the term, clawbacks are provisions that are included in employment contracts which allow the principal (i.e. the employer) to limit bonus compensation upon the occurrence of certain events specified in the employment contract. Moral hazard and measures taken to mitigate the problem The reason why clawbacks generate a great deal of discussion is largely as a result of the sub-prime mortgage crisis. Public and political commentators have opined that one major factor contributing to the crisis was that of moral hazard. Pre-2008, traders could take a lot of risks for a chance at an outsized payout. If it worked, the trader would be compensated heavily. If the trade failed, the trader would be fired. However, the downside risk was minimal as the trader could simply get employed at another firm. With the possibility of an outsized payout and minimal downside risk, incentives were highly asymmetric. Thus, to mitigate the problem of moral hazard, clawbacks were proposed by the SEC. However, I believe that the Commission is going too far as its current proposal would extend to all publicly-traded companies , instead of just financial institutions. Essentially, the new proposal would obligate public companies to recover incentive-based compensation from executives for up to three years if they ever have to restate their earnings. Due to the all-encompassing nature of the provision, I believe that this topic should be of great interest to investors who invest in corporate America (NYSEARCA: SPY ) – in other words, nearly every investor out there. The proposal is deceptively simple. Despite its simplicity, I believe that there are severe ramifications that may materialize if it is passed. These ramifications primarily revolve around the misalignment of interests between shareholders and management . In his piece, Mr. Sorkin explained briefly how base/incentive compensation may be affected. Due to his brevity, I believe that readers may not have grasped the essence of his article. Therefore, I will expand upon the points he made. Before I do that, I believe that some context is required. A brief history of compensation Historically, employers compensated employees with a fixed base salary that grows by a small amount (usually somewhat correlated with inflation) every year. However, employers soon realized that this model was not sufficient to motivate their employees. As they were being paid a fixed base salary, employees were not incentivized to strive for performance – they were happy to complete the minimum required of them. After all, there was no need to outperform; there were no financial rewards for outperformance. Lip service might be given as a courtesy, but we all know what that is worth. In a bid to motivate outperformance, employers soon started offering bonus compensation to employees that exceed what was required of them. This bonus compensation can come in many forms – restricted stock, stock options, etc. However, they all have one thing in common. They were tied to performance. Some may be tied to sales targets, others may be tied to profit targets. This compensation model worked well for a while. However, employees soon found that it was a better idea to take stratospheric levels of risk for a probability at an immense financial payout. This produced the rogue traders that I believe that many readers are familiar with (London Whale, Nick Leeson, etc). The new SEC proposal The Commission’s new proposal is intended to mitigate the problem of moral hazard that comes with the asymmetric compensation model discussed above. The idea is rather simple – an employee that takes projects with unusually high amounts of risk may manage to achieve success in the short-term, but in the long-term the proposition is likely to blow up. Said another way, profits in the short-term might be outsized, but may need to be restated in the future (after being marked-to-market, for example). Thus, the employee would be compensated on the basis of the restated profits (which are typically much lower). In theory, it seems like it would work out. However, the situation is likely to manifest very differently in practice. Faced with reduced bonus compensation, executives are likely to take one of two routes: increase base compensation substantially to offset the decrease in bonus compensation, or increase bonus compensation to such a height that would ensure bonus compensation remain at pre-proposal levels post-proposal. Both routes are equally dismal for shareholders of corporate America. Suppose base compensation was increased in order to offset the decrease in bonus compensation. In this case, the situation would simply revert back to what it was historically – where employees were compensated with a salary that was largely fixed. Incentives for outperformance would be minimal. Thus, management would not be motivated to strive for performance. It is likely that management would simply be concerned with keeping their jobs, thus reducing the likelihood of them taking on large projects that would allow their company to grow. After all, there is no incentive to. As a result, shareholders of corporate America like you and me would be paying more for management that is content with maintaining the status quo. Growth realized by the S&P 500 has been sluggish in recent years, and the new proposal would exacerbate the problem. Alternatively, suppose that bonus compensation was increased to such a height that would ensure bonus compensation remains at pre-proposal levels post-proposal. In this situation, the net effect on bonus compensation would be minimal. However, as this scenario implicitly requires bonus compensation to be tied to a larger percentage of performance, the incentive to take on extremely high-risk projects would be heightened even further. In a nutshell, the problem of moral hazard would be amplified. Shareholders would be footing the bill once again. Expect this to contribute to a repeat of the 2008 crisis. In addition to the above, I believe that there other ramifications to consider as well. Other possible consequences Due to the fact that restatements of earnings tend to be as a result of an honest accounting error for the most part, corporate America as a whole is likely to hire more compliance personnel in a bid to minimize the possibility of error. Although compliance personnel play an important role, they do not generate any revenue or profit for the company. They are a necessary cost, but a cost nonetheless. For particularly large organizations, the increase in hiring of compliance personnel is likely to be substantial, which will materially reduce their bottom line. Once again, shareholders end up picking the tab. Recent regulation that called for banks to hold more capital (per Basel standards) have greatly reduced market liquidity . I opine that if this new SEC proposal was passed, liquidity would decline even further. It is no secret that financial institutions such as Citigroup (NYSE: C ), Goldman Sachs (NYSE: GS ) and Bank of America (NYSE: BAC ) are market-makers. Market-makers provide liquidity to the markets. They stand by willing to sell or purchase securities to and from willing market participants. Without a doubt, their role is a vital one. Recall that the new SEC proposal allows bonus compensation to be recovered in the event of a restatement of earnings. Mark-to-market gain/losses are one example of one such event. As bonus compensation is typically far greater than base compensation, executives of financial institutions are likely to cut back their presence in market-making in order to reduce the probability of the firm suffering from huge mark-to-market losses. Due to increased illiquidity, investors should expect increased volatility if the proposal is passed. Conclusion The new proposal proposed by the SEC aims to rein in outsized compensation. Despite its well-intended nature, the proposal is likely to result in widespread ramifications across corporate America if it is passed. No matter how you slice it, a misalignment of interests between shareholders and management are sure to occur. Increased compliance costs should follow as well. When all is said and then, public shareholders would be the one footing the bill. Additionally, the proposal could also result in a further diminishing in market liquidity, which would increase illiquidity. Although the proposal has not been passed yet, I believe that there is a high likelihood that it would be. The general public has always been inundated and resentful towards executives who command high levels of compensation. A proposal that aims to reduce compensation levels would likely be very popular. However, such proposals may have unintended consequences as detailed above. As these consequences are far-reaching, I believe that every investor should take note of the situation and perhaps consider investing abroad where public companies are not subject to SEC regulation. Disclosure: I/we have no positions in any stocks mentioned, and no plans to initiate any positions within the next 72 hours. (More…) I wrote this article myself, and it expresses my own opinions. I am not receiving compensation for it (other than from Seeking Alpha). I have no business relationship with any company whose stock is mentioned in this article.
SPY’s 2015 2nd-Quarter Performance And Seasonality

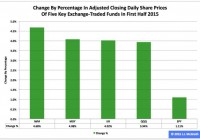
Summary The SPDR S&P 500 ETF in the first half ranked No. 3 among the three most popular exchange-traded funds based on the S&P Composite 1500’s constituent indexes. In the second quarter, the ETF’s adjusted closing daily share price advanced by a rather small 0.22 percent. In June, the fund’s share price declined by a rather large -2.01 percent. The SPDR S&P 500 ETF (NYSEARCA: SPY ) during 2015’s first half was third by return among the three most popular ETFs based on the S&P Composite 1500’s constituent indexes, which encompass the SPDR S&P MidCap 400 ETF (NYSEARCA: MDY ) and the iShares Core S&P Small-Cap ETF (NYSEARCA: IJR ). SPY edged higher to $205.89 from $203.64, an increase of $2.25, or 1.11 percent, but it behaved worse than MDY by -2.98 percentage points and IJR by -2.91 percentage points. Figure 1: Change In Share Prices Of Five Key ETFs In First Half (click to enlarge) Source: This J.J.’s Risky Business chart is based on analyses of adjusted closing daily share prices at Yahoo Finance . Market day in and market day out, I analyze in multiple ways 13 ETFs through my Risky Business Daily Market Seismometer : These funds are SPY, MDY and IJR, as well as the nine Select Sector SPDRs and the small-capitalization iShares Russell 2000 ETF (NYSEARCA: IWM ). I also assess the large-cap (and technology-dominated) PowerShares QQQ (NASDAQ: QQQ ), albeit on a comparatively infrequent basis. Thanks to this monitoring, I anticipate being shocked by market events on occasion, but I do not expect being surprised by them. Anyway, SPY in the first half of the year was the worst performer among the five key ETFs I employ to evaluate equity classes by market cap (Figure 1). Figure 2: Change In Share Prices Of Five Key ETFs In Second Quarter (click to enlarge) Source: This J.J.’s Risky Business chart is based on analyses of adjusted closing daily share prices at Yahoo Finance. SPY was neither the best behaved nor the worst behaved of my five key ETFs last quarter, as these distinctions were claimed by QQQ in the former case and MDY in the latter case (Figure 2). I believe SPY’s lackluster performance, not only in Q2 but also in 2015, is associated with the bias divergence in monetary policy at big central banks around the world whose effects I have discussed ad nauseam at Seeking Alpha, most recently in “NYSE Margin Debt Remains Near All-Time High In May: Risk Rank At No. 53.” Figure 3: Changes In Share Prices Of Five Key ETFs In June (click to enlarge) Source: This J.J.’s Risky Business chart is based on analyses of adjusted closing daily share prices at Yahoo Finance. Greece’s failure to make its payment to the International Monetary Fund Tuesday was preceded by a protracted period of silly shilly-shallying uncommon even by the standards of the eurozone, which is really saying something. The headline risk clearly had an impact on the U.S. stock market, with the beatdown victimizing larger caps more than smaller caps (Figure 3). This disparity in outcomes makes sense because the S&P 500 index firms that provided the data required to paint a complete picture of their global sales in 2012 indicated they booked 53.4 percent of their sales inside the U.S. and 46.6 percent of their sales outside the U.S., as discussed elsewhere . The comparable numbers for S&P 600 index firms the same year were 61.0 percent and 39.0 percent, in that order. As a result, SPY is more exposed to conditions around the world than is IJR. Figure 4: SPY Monthly Change, 2015 Vs. 1994-2014 Mean (click to enlarge) Source: This J.J.’s Risky Business chart is based on analyses of adjusted closing monthly share prices at Yahoo Finance . SPY behaved a lot worse in the first half of 2015 than it did during the comparable periods in its initial 21 full years of existence based on the monthly means calculated by employing data associated with that historical time frame (Figure 4). The same data set shows the average year’s strongest quarter was the fourth, with an absolutely large positive return, and its weakest quarter was the third, with an absolutely small positive return. Figure 5: SPY Monthly Change, 2015 Vs. 1994-2014 Median (click to enlarge) Source: This J.J.’s Risky Business chart is based on analyses of adjusted closing monthly share prices at Yahoo Finance. SPY also performed a lot worse in the first half of 2015 than it did during the comparable periods in its initial 21 full years of existence based on the monthly medians calculated by using data associated with that historical time frame (Figure 5). The same data set shows the average year’s strongest quarter was the fourth, with an absolutely large positive return, and its weakest quarter was the third, with an absolutely small positive return. Disclaimer: The opinions expressed herein by the author do not constitute an investment recommendation, and they are unsuitable for employment in the making of investment decisions. The opinions expressed herein address only certain aspects of potential investment in any securities and cannot substitute for comprehensive investment analysis. The opinions expressed herein are based on an incomplete set of information, illustrative in nature, and limited in scope. In addition, the opinions expressed herein reflect the author’s best judgment as of the date of publication, and they are subject to change without notice. Disclosure: I/we have no positions in any stocks mentioned, and no plans to initiate any positions within the next 72 hours. (More…) I wrote this article myself, and it expresses my own opinions. I am not receiving compensation for it (other than from Seeking Alpha). I have no business relationship with any company whose stock is mentioned in this article.

Risk Aversion Gains Momentum And Risk Taking Loses It

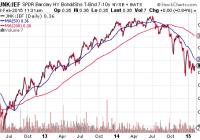
There is little doubt that the appeal of traditional safer havens is on the rise. What may be worthy of debate is whether or not stock assets will find their footing. Whether it is risk aversion, relative value or limited supply, the only thing that will dampen my enthusiasm for treasuries would be remarkable evidence of a worldwide turnaround in growth. The case for investing in riskier assets has often been described as a sensible quest for yield and/or capital appreciation in a world with ultra-low interest rates. That helps to explain why the S&P 500 has defied the odds with respect to corrective activity, garnering double-digit percentage gains in 2012, 2013 and 2014. Yet the preference for risk averse treasuries over higher-yielding debt since July of last year puts a dent in the notion that speculation is still in vogue; rather, investors have been balking at funds like the SPDR Barclays Capital High Yield Bond ETF (NYSEARCA: JNK ) in favor of safer bond funds with similar average maturity data such as the iShares 7-10 Year Treasury Bond ETF (NYSEARCA: IEF ). Note the indisputable shift towards safety that the JNK:IEF price ratio depicts. Of course, there are other ways to interpret widening credit spreads between high yield and U.S. sovereign debt. Struggling oil companies may represent as much as 20 percentage points of junk bond proxies. And, since one cannot sell a fraction of an ETF, investors may feel forced to liquidate baskets in their entirety. There’s some truth in that. What’s more, there is truth in the notion that the popularity of longer-maturity Treasury ETFs – IEF, the iShares 10-20 Year Treasury Bond ETF (NYSEARCA: TLH ), the Vanguard Extended Duration Treasury ETF (NYSEARCA: EDV ), the PIMCO 25+ Year Zero Coupon U.S. Treasury Index ETF (NYSEARCA: ZROZ ) – is a function of relative value ; indeed, foreign money may prefer 1.7% from a 10-year U.S. treasury to a 10-year German bund yielding 0.3%. On the other hand, this downplays the notion that risk aversion has been gaining momentum. For instance, nearly every component of the FTSE Custom Multi-Asset Stock Hedge Index has gained ground since the Federal Reserve ended its QE3 program at the tail end of October, while U.S. stock assets have been relatively flat amid increasing intra-day volatility. What’s more, ETFScreen.com shows the relative strength factor (Rsf) for all ETFs as they change each week across a three-month span. This helps investors get a feel for potential momentum changes in the ETF universe. Risk Aversion Gains Momentum And Risk Taking Loses It Risk (U.S. Stocks and High Yield Bond) 5-Nov 3-Feb SPDR S&P 500 Trust ETF (NYSEARCA: SPY ) 83.5 73.0 iShares Russell 2000 ETF (NYSEARCA: IWM ) 65.5 62.3 JNK 46.7 41.9 Multi-Asset Stock Hedge Components PowerShares DB USD Bull ETF (NYSEARCA: UUP ) 72.1 88.6 iShares 10-20 Year Treasury Bond ETF ( TLH ) 60.6 82.9 SPDR Gold Trust ETF (NYSEARCA: GLD ) 10.8 47.7 In sum, there is little doubt that the appeal of traditional safer havens is on the rise. What may be worthy of debate is whether or not stock assets will find their footing. For what it is worth, I have not given up on them. I continue to favor those ETF assets that should benefit from deflationary global pressures, worldwide stimulus measures and a belief that the Federal Reserve will ultimately push off a token rate hike into Q4 of 2015. Germany should benefit more for the European Central Bank’s QE than the rest of its euro-zone partners. It should also benefit more than the other members from the euro-dollar’s depreciation, as it is the largest exporter to countries outside of Europe. I am favoring the iShares Currency Hedged MSCI Germany ETF (NYSEARCA: HEWG ). The gains have been substantial over a three-month period where mainstay U.S. benchmarks have floundered. By the same token, as I have done for nearly fourteen months, I continue to add to long-duration treasury funds like TLH and EDV, particularly on pullbacks to the 50-day moving average. Whether it is risk aversion, relative value or limited supply, the only thing that will dampen my enthusiasm for treasuries would be remarkable evidence of a worldwide turnaround in growth. For now, however, global growth appears more likely to weaken further. Click here for Gary’s latest podcast. Disclosure: Gary Gordon, MS, CFP is the president of Pacific Park Financial, Inc., a Registered Investment Adviser with the SEC. Gary Gordon, Pacific Park Financial, Inc, and/or its clients may hold positions in the ETFs, mutual funds, and/or any investment asset mentioned above. The commentary does not constitute individualized investment advice. The opinions offered herein are not personalized recommendations to buy, sell or hold securities. At times, issuers of exchange-traded products compensate Pacific Park Financial, Inc. or its subsidiaries for advertising at the ETF Expert web site. ETF Expert content is created independently of any advertising relationships.