Tag Archives: nysearcaive

Digging Beneath The Surface Of 2 Concentrated Value ETFs

Summary We have seen a big shift in investor appetite away from traditional value companies and into high flying growth names over the last several years. The August correction may afford an opportunity to purchase value ETFs at attractive prices when compared to broad equity benchmarks. Two relatively new ETFs came across my watch list as potential candidates for investors seeking an outside the box approach to value selection screens. We have seen a big shift in investor appetite away from traditional value companies and into high flying growth names over the last several years. That trend has continued in 2015, yet the recent volatility may have investors reconsidering the fundamental qualities of the stocks in their portfolio. Growth stocks tend to fall harder during corrective phases as investors flock to the safety of defensive or value-oriented sectors. Furthermore, the August correction may afford an opportunity to purchase value ETFs at attractive prices when compared to broad equity benchmarks. Two relatively new ETFs came across my watch list as potential candidates for investors seeking an outside the box approach to value selection screens. Both funds are built using a more concentrated portfolio focused on stocks with solid balance sheets and sound business qualities. ValueShares U.S. Quantitative Value ETF (BATS: QVAL ) QVAL is an actively managed ETF that debuted in late 2014 and has amassed over $50 million in assets spread amongst 40-50 individual holdings. This fund is managed by Wesley R. Gray, Ph.D. who has written extensively on the attributes of quantitative values and behavioral finance. QVAL uses three separate screening criteria to hone in on a focused number of stocks that it believes offer solid value alongside quality long-term business fundamentals. The goal is to invest in the cheapest, high quality stocks in order to try and outperform a more passive index. QVAL benchmarks its performance versus the iShares S&P 500 Value ETF (NYSEARCA: IVE ) and so far this year it has been able to maintain a similar total return. Prior to the recent correction, this actively managed ETF was actually significantly outperforming the passively managed yardstick. It’s worth pointing out that IVE is a market cap weighted index of 359 holdings, while QVAL takes a more equal weighted approach to its portfolio construction methodology. In addition, QVAL charges an expense ratio of 0.79%, compared to 0.18% for its passive counterpart. The significantly higher fees of the actively managed portfolio are to be expected for a unique strategy using proprietary screening and construction methodologies. Nevertheless, QVAL needs to prove that its approach adds value (pardon the pun) to investors that choose to step outside the passive index realm. In my opinion, this fund should warrant consideration for those seeking an alpha generating strategy for the value sleeve of their equity portfolio. Deep Value ETF (NYSEARCA: DVP ) DVP is another value-oriented strategy that debuted in 2014. This fund is based on the TWM Deep Value Index, which is constructed of 20 dividend paying stocks within the S&P 500 Index with solid balance sheets, earnings and strong free cash flow. According to the fund company website, the companies within the index are weighted based on a “rules-based assessment of their valuations so that stocks that are most attractively valued receive a higher weight.” In addition, the index is reconstituted annually. The extremely concentrated nature of the DVP portfolio makes for an interesting study in what is essentially a smart-beta index. The smaller number of holdings will likely create a greater divergence from the benchmark than a more traditional approach. This ETF will be more susceptible to individual business risks and opportunities of the underlying stocks than its peers as well. I would expect that the DVP portfolio will experience pronounced periods of underperformance and outperformance depending on the prevailing market environment . DVP has managed to accumulate over $200 million in total assets and charges a similar expense ratio as QVAL at 0.80%. This ETF is certainly worth a look for investors that like the comfort of a passive index with a stock picker’s mentality. The Bottom Line There are pros and cons to selecting ETFs that fall outside the traditional realm of low-cost and well-diversified benchmarks. However, both of these funds offer a unique approach to value investing that should not be overlooked. They can potentially add value as tactical positions that compliment your core ETF portfolio. Disclosure: I/we have no positions in any stocks mentioned, and no plans to initiate any positions within the next 72 hours. (More…) I wrote this article myself, and it expresses my own opinions. I am not receiving compensation for it. I have no business relationship with any company whose stock is mentioned in this article. Additional disclosure: David Fabian, FMD Capital Management, and/or clients may hold positions in the ETFs and mutual funds mentioned above. The commentary does not constitute individualized investment advice. The opinions offered herein are not personalized recommendations to buy, sell, or hold securities.
High Beta Underperforming Low Volatility

As the market continues to trade sideways in its, seemingly, directionless trade, it is helpful to observe various intermarket relationships and technical indicators to see what exactly is driving returns and to check-up on the overall health of the market. One interesting dynamic of the market this year is the underperformance of high beta stocks in relation to low volatility stocks. In a typical bull market, high beta stocks outperform as market psychology shifts to a “risk on” mindset where cyclical companies (such as high beta and high growth stocks) are favored over non-cyclical companies that provide lower, more protected exposure. This has not been the case this year. High beta stocks have underperformed low volatility stocks measured by the ratio of the performance of the PowerShares S&P 500 High Beta Portfolio ETF (NYSEARCA: SPHB ) over the PowerShares S&P 500 Low Volatility Portfolio ETF (NYSEARCA: SPLV ) . As the ratio moves higher, high beta is outperforming low volatility and as the ratio moves lower, low volatility is outperforming high beta. The performance dispersion can partially be explained by the difference in sector weighting of these two ETFs. Given SPHB’s high beta, cyclical tilt, overweights in Energy and Industrials have been a big drag on performance. Conversely, SPLV has no Energy exposure and higher weightings to Consumer Staples and Health Care, two sectors that traditionally carry lower volatility and have outperformed the broader market this year. These are a few examples of why the low volatility strategy is outperforming not only high beta names this year, but has also caught up to the S&P 500. This being said, it is interesting to note that growth stocks are still outperforming value stocks in the same time period, shown by the relationship between the iShares S&P 500 Growth ETF (NYSEARCA: IVW ) and the iShares S&P 500 Value ETF (NYSEARCA: IVE ) . While this is not a new dynamic to this bull market, the amplified disparity in performance since the end of June is noteworthy as investors continue to favor companies with higher growth rates in this slow, bump along environment. High beta stocks may reverse trend and outperform the low volatility strategy should the market resume a trend to new highs, but until then, low volatility is in play. Share this article with a colleague

S&P 500 FCF Analysis: What You Do Depends On Who You Are

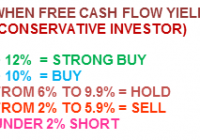
Analysis of the S&P 500 Index and its individual components using the “Free Cash Flow Yield” ratio. Specifically written to assist those Seeking Alpha readers who are using my free cash flow system. Generates a final result for the S&P 500 Index and explains that result to each reader depending an what type of investor they are. Back in December of last year, I introduced my free cash flow system here on Seeking Alpha, through a series of articles that you can view by going to my SA profile . My purpose in doing so was to try and teach as many investors as I could, on how to do this simple analysis on their own, as I believe in the following: “Give a person a fish and you feed them for a day, Teach a person to fish and you feed them for life” I have been very pleased with the positive feedback that I have received so far, but included in that feedback were many requests by those using my system, to see if they did their analysis correctly or not. Since the rate of these requests has been increasing with every new article I write, I have decided to start a new series of articles here on Seeking Alpha analyzing the S&P 500 Index, where I will analyze each of its components individually. That way those of you using my system will have something like a “teacher’s edition” that will give you all the correct calculations for each component. Obviously I can’t include the results for all my ratios in one article, so I will thus be doing a series of articles, where each ratio’s results for the S&P 500 Index will have its own article devoted to it. Hopefully these articles can be used as reference guides that everyone can use over and over again, whenever the need arises. Having said that, at the same time we will be “killing two birds with one stone” as we will also be analyzing the S&P 500 Index and give one final result for it as well as its individual components . That way these series of articles will also be able to give us a real time analysis of whether the S&P 500 Index is attractively priced or overvalued. In order to save space in this article (as the table that will soon follow is quite long) I would welcome everyone to read my article on how to analyze a portfolio/Index by clicking on the following link first: Warren Buffet s Berkshire Hathaway Portfolio: A Free Cash Flow Analysis That way those of you who are new to this analysis will get a complete introduction and for others already familiar with my work, let it act as a refresher course. This article with concentrate on my “Free Cash Flow Yield Ratio” Free Cash Flow Yield = Free Cash Flow per Share / Stock Market Price One key point to always remember in using this system, is that it is designed for all kinds of investors, whether you would be conservative (like I am) or a more aggressive/buy & hold investor. I have created the following parameters for each type and they are as follows: Finally it is also important to understand that I personally do not invest in financial firms as a rule, because it is quite difficult to get a very accurate free cash flow result. This is so because financial firms generate very little in the way of capital expenditures, thus the results you find below are basically just cash flow from operations. I still analyze them as they are part of the S&P 500 Index, but again I don’t invest in them as I find financial firms too complicated to analyze. This belief of not investing in financials, saved me from suffering the huge losses that this sector suffered in 2008-2009, which cost investors dearly. For those who disagree we can start a discussion on the matter in the comment section below, which will allow me to further elaborate on the matter. So without further ado here is my “Free Cash Flow Yield Analysis of the S&P 500 Index (NYSEARCA: SPY ) and its components: (click to enlarge) The final free cash flow yield result of 5.11% for the S&P 500 Index would be classified as a ” Strong Hold” for the more aggressive/ buy & hold investor and a “Weak Sell” for the more conservative investor, using the parameter tables I included at the beginning of the article . The weightings that you see in the index were generated by mirroring those used in the SPDR S&P 500 ETF . Also remember that the results shown above are just for one ratio and that this is not investment advice, but just the results of the ratio. The system outlined in this article and all that will follow, as part of this series, are just meant to be used as reference material to be included as just “one” part of everyone’s own due diligence. So in other words, don’t make investment decisions based on just this one result, but incorporate it as one part of your own due diligence.