Tag Archives: nysearcaidu

3 Utility ETFs Suffering From Rate Hike Worries

Banking on strong recovery in the U.S. economy, analysts are expecting a possible rate hike in September or October this year. Meanwhile, rate hike worries have been weighing on the major benchmarks. Recently released economic data including construction spending, auto sales and job number all came in on the strong side. These have elevated the rate hike possibility further. Strong Economic Recovery After having a dull first quarter, the economy rebounded strongly in the second as indicated by several economic data. The Fed also remained optimistic about a recovery in the second quarter based on strong labor and housing data. According to the U.S. Labor Department, the U.S. economy created a total of 280,000 jobs in May, witnessing the largest job addition since December 2014. Though the unemployment rate marginally rose to 5.5% in May, the rate is expected to decline gradually to Fed’s target this year. The average hourly wages also witnessed a strong year-on-year gain of 2.3%. Among other major economic data, the U.S. Department of Commerce reported that construction spending surged 2.2% in April, its fastest pace since May 2012. Also, most of the major housing data showed that the housing market recovered strongly in April. Meanwhile, U.S. light-vehicle sales gained 1.6% year over year to 1.63 million units last month, witnessing its best May ever in terms of light vehicle sales. Rate Hike Worries Strong economic data indicates that the economy is back on track in the second quarter, leaving behind the first-quarter contraction. This raises the possibility of a rise in interest rates, which have been near zero since the 2008 financial crisis. Before deciding on a rate hike, the Fed will closely watch the labor market situation and the inflation rate. However, the Fed remained “reasonably confident that inflation will move back to its 2% objective over the medium term”. The evolving macro environment points toward a possible rate hike in the not-too-distant future. Stock market investors are finding this prospect somewhat discouraging, which has been showing up in the market’s daily activity in recent sessions. Higher interest rates can make stocks less appealing and especially so in the dividend space. In this scenario, sectors including utilities that are expected to be affected by a rate hike have suffered heavily in recent times. 3 Utility ETFs Suffering The Utility sector is one of the most rate-sensitive sectors due to its high level of debt. Utilities are capital-intensive businesses and the funds generated from internal sources are not always sufficient for meeting their requirements. As a result, the companies have to approach the capital markets for raising funds. As a result, a rising rate environment may have a negative impact on this sector. Here, we highlight 3 utility ETFs that have suffered in recent times on rate hike worries. PowerShares DWA Utilities Momentum Portfolio (NYSEARCA: PUI ) This fund provides exposure across 40 securities by tracking the DWA Utilities Technical Leaders Index. Nearly 40% of total assets are allocated to the top 10 holdings. Sector-wise, multi-utilities take the top spot at 37.7%, while electric utilities and gas utilities take the next two positions. PUI has amassed $31.9 million in its asset base while it sees light volume of around 9,000 shares a day. The ETF has 0.60% in expense ratio and has declined 3.7% over the past one month. Guggenheim S&P 500 Equal Weight Utilities ETF (NYSEARCA: RYU ) This fund follows the S&P 500 Equal Weight Index Telecommunication Services & Utilities, holding 36 stocks in its portfolio. It is well diversified across its holdings with none of the companies accounting for more than 3.2% of the total assets. The ETF has been able to manage $128.3 million in its asset base and is moderately traded with more than 58,000 shares per day. It charges 40 bps in annual fees and expenses. The product has declined 3.2% in the trailing one-month period. iShares U.S. Utilities ETF (NYSEARCA: IDU ) This ETF provides exposure to 61 firms by tracking the Dow Jones U.S. Utilities Index. The fund has amassed $583.3 million in its asset base while it sees a moderate volume of around 417,000 shares a day. The product is largely concentrated in the top 10 firms that collectively make up for half of the basket. About 52% of its assets are allocated to electric utilities. The ETF charges a fee of 43 bps annually and has lost more than 2.9% in the past one month. Original Post
Are Rate-Sensitive ETFs Suggesting Economic Weakness Ahead?

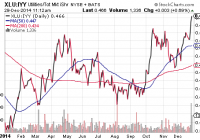
I am baffled by the economic acceleration certainty that nearly every respected voice has endorsed. In spite of the rosiest government data on jobs and GDP, which ETF asset classes proved most resilient in a month of volatile price movement? Utilities and REITs. The more the public is being told about the inevitability of rate increases, the greater the momentum for proxies like XLU and VNQ. Lost in the bull market euphoria is the reality that economists have been dead wrong about the direction of asset prices, particularly bond prices. Last December, when 55 of the most prestigious economists across a wide range of institutions had been polled by Bloomberg about where the 10-year yield (3.0%) would end the year, each of the 55 professionals anticipated higher rates. The average of those estimates? 3.41%. And yet, the 10-year will finish the year closer to 2.25%. That is one heck of an astonishing miss for the entire professional community. This December, polling of economists has produced an average forecast for the 10-year yield at 3.0% by the close of 2015. In other words, they expect intermediate term rates will climb in 2015, and yet, the projections merely approximate where 2013 ended. Even if the recent crop of poll respondents are correct this time around, what does this “non-normalization” of rates tell us about the highly touted strength of the U.S. economy? For all the hoopla, I am baffled by the economic acceleration certainty that nearly every respected voice has endorsed. Will Q4 gross domestic product (GDP) be as robust as the 5% in Q3? Not likely. Will Q1 2015 be better than the average of 2.1% sub-par growth that has existed each year since the Great Recession ended? Probably not. For one thing, lower bond yields have been warning U.S. investors that the world’s stagnation alongside regional recessions will eventually weigh down the U.S. It is one thing to pretend that the U.S. is a self-contained economic island, yet quite another thing to ignore the reality that close to 50% of corporate profits come from overseas. Moreover, there are a variety of potential crises that could sap the world (and yes, the U.S.) of economic demand, from a disorderly slowdown in China to an emerging market credit collapse to a second iteration of a euro-zone break-up scare. Need proof that scores of investors remain unconvinced by the notion that all is perfect in stock-land? In spite of the rosiest government data on jobs and GDP – in spite of strong retail sales as well as consumer confidence readings – which ETF asset classes proved most resilient in a month of volatile price movement? Utilities and REITs. Are The Bets On Lower Rates Still Continuing? MOM% SPDR Select Sector Utilities (NYSEARCA: XLU ) 9.0% iShares DJ Utilities (NYSEARCA: IDU ) 8.7% Vanguard Utilities (NYSEARCA: VPU ) 8.6% iShares Cohen Steers Realty Majors (NYSEARCA: ICF ) 4.2% Vanguard REIT (NYSEARCA: VNQ ) 4.2% SPDR DJ REIT (NYSEARCA: RWR ) 4.1% iShares DJ Total Market (NYSEARCA: IYY ) 1.0% If an investor is looking for modest growth in an area less tied to the economy, he/she may journey to the consumer staples segment or the health care sector. They are frequently identified as “non-cyclicals” since they represent things we need in good times and bad. And if an investor is looking for more total return in areas less tethered to economic well-being, he/she often travels to utilities and REITs. The exception to that rule? If rates are expected to rapidly rise across the yield curve, an investor would tend to shy away from the rate sensitivity associated with utilities and REITs. That’s not happening. In fact, the more the public is being told about the inevitability of rate increases, the greater the momentum for proxies like XLU and VNQ. The price-ratios for XLU:IYY as well as VNQ:IYY are at or near their highest points of 2014. I am not advocating that investors abandon economically sensitive stock assets let alone chase yield-sensitive stock segments. On the other hand, just as I recommended throughout 2014, I believe it makes sense to remain committed to longer-term bonds in funds like iShares 10-20 Year Treasury (NYSEARCA: TLH ) as well as lower volatility stocks across the sector spectrum. One of my largest client holdings, iShares USA Minimum Volatility (NYSEARCA: USMV ), is diversified across all of the economic sectors; the top 3 segments are health care, financials and information technology. What makes USMV particularly attractive in the current environment? The equities have lower volatility properties relative to the U.S. market at large, offering the possibility that losses during declining markets will be less dramatic. Similarly, gains in rising markets will emanate from exposure to strong economy stock sectors as well as weaker economy stock sectors. Click here for Gary’s latest podcast. Disclosure: Gary Gordon, MS, CFP is the president of Pacific Park Financial, Inc., a Registered Investment Adviser with the SEC. Gary Gordon, Pacific Park Financial, Inc, and/or its clients may hold positions in the ETFs, mutual funds, and/or any investment asset mentioned above. The commentary does not constitute individualized investment advice. The opinions offered herein are not personalized recommendations to buy, sell or hold securities. At times, issuers of exchange-traded products compensate Pacific Park Financial, Inc. or its subsidiaries for advertising at the ETF Expert web site. ETF Expert content is created independently of any advertising relationships.

Utilities: The High-Flyers Of 2014

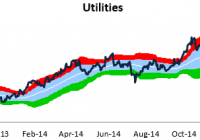
The S&P 500 Utilities sector is closing out 2014 with a bang. As shown below, the sector is currently in the midst of another big momentum move higher into extreme overbought territory – currently trading more than two standard deviations above its 50-day moving average. The sector is up a whopping 28% year-to-date – easily the top performing sector of 2014. No wonder so many portfolio managers are underperforming this year. Utilities – the most defensive, low-growth sector of the market – has been leading the way. It’s tough to sell investors on a big overweight position in utilities, especially in a rising rate (at least those are the expectations) environment. But if you haven’t owned utilities, chances are you’ve lost ground to the S&P this year. After this recent move into the stratosphere, the P/E ratio for the utilities sector has jumped up to 18.77. That’s high, especially in relation to the P/E ratio of the S&P 500 as a whole. At 18.77, the P/E for utilities is actually 0.27 points higher than the P/E for the S&P 500 (18.50). Now that you’ve read this, are you Bullish or Bearish on ? Bullish Bearish Sentiment on ( ) Thanks for sharing your thoughts. Why are you ? Submit & View Results Skip to results » Share this article with a colleague