Tag Archives: nysearcagld

Low Risk And Long-Term Success Portfolio Update 2015

2015 will be a year of minimal returns for broad S&P 500 funds, but will be a good year for international funds and gold. High yielding investments in vehicles such as REITs could see lots of volatility due to interest rate risks. Investors should consider taking some profit off of U.S. equities and diversifying internationally to take advantage of lower valuations and room for P/E expansion. The last few years have been fantastic for exchange-traded funds (ETFs), according to data accessed by ETF.com. In fact, U.S. stock ETFs have surpassed last year’s inflow records, and for the first time ever, U.S. ETFs have surpassed $2 trillion. A popular S&P 500 ETF, the SPDR S&P 500 Trust ETF (NYSEARCA: SPY ), has seen the heaviest inflows at nearly $25 billion in 2014. In contrast, emerging market ETFs (NYSEARCA: EEM ) and gold ETFs (NYSEARCA: GLD ) have seen outflows. This marks a perfect opportunity for a trite quote from Warren Buffet, “Be fearful when others are greedy and greedy when others are fearful.” My theory is that many investors have missed out on the upswing of the market and are now “performance chasing” because they feel left out. I am taking the contrarian position and urging to shift some money out of direct investments in the U.S. equity market, and consider larger allocations to international markets, and even emerging market exposure. The original portfolio I created on April 9, 2013, can be accessed here . My portfolio has underperformed the S&P 500 by a significant extent; however, the portfolio I created also contained 18% allocation to bonds, 17% international exposure, emerging markets, and gold. This diversification has led to lackluster performance as the S&P has surged. Keep in mind this is not a portfolio built for everyone. Based on your tolerance for risk and your investment objectives, the amount of money you allocate to certain asset classes must make sense for your goals. In my asset allocation methodology for this year and beyond, I am making some key assumptions that are worth noting. Firstly, I believe the market is fairly valued to slightly overvalued based on historical price-to-earnings ratios. Due to the low interest rate environment, low inflation rate, and the quantitative easing actions of the Federal Reserve, I believe that inflated price-to-earnings ratios makes sense. With that being said, I feel that rates will increase to some extent in this year and that investors seeking high yield investments should be wary. Instead of riding out the high yield environment, my first action will be to remove the allocation to the Vanguard REIT Index ETF (NYSEARCA: VNQ ), and keep my position in the Vanguard High Dividend Yield ETF (NYSEARCA: VYM ). The reason that I am not recommending a reduction in VYM is because of the amount of high quality value stocks found in this fund. What I am certain many people hear all too often are obscure references to the stock market stating it is too high or too low. What I rarely hear are defined examples of why they believe the market is high or low, or by what measuring stick they are referencing. I tend to favor the simplistic. A quick answer to the “Why?” that many investors ask is an indicator of market valuation by economist and well-known author of Irrational Exuberance – Robert Shiller. The Shiller price-to-earnings ratio is calculated using the annual earnings of the S&P 500 over the past 10 years. The past earnings are adjusted for inflation using CPI, bringing them to today’s dollars. The regular price-to-earnings ratio is just shy of 20, which is right at the historical average. (click to enlarge) Based on this information, I believe the market is fully valued. Most agree with the contention that the price-to-earnings ratio of the S&P isn’t trading at a huge bargain. The actions of the Federal Reserve may push the S&P to further valuations above historical averages. My personal view is that while you cannot time the market, you also should avoid pouring into the market when it appears fully valued as many appear to be doing. In fact, at this point I would be doing the opposite of the crowd. Emerging markets and precious metals offer value, and I believe smart money is moving into these asset classes. Using the proceeds from my sale of VNQ, I would purchase the Schwab International Equity ETF (NYSEARCA: SCHF ). This is an international large blend style ETF, sector weighted in financials at an expense ratio of only .08% that will reward patient investors in the long run. I also like that their top holding is Nestle SA ( OTCPK:NSRGY ). The regional breakout provided by Morningstar is roughly 18% exposure to the United Kingdom, 37% exposure to Europe developed, 20% exposure to Japan, 7% Australia, 8% Asia developed, and 8% to the U.S. Gold and the U.S. dollar are inversely related, as you can see from the chart from Macrotrends . While I do not believe gold will experience incredible growth and I cannot promise grandeur, I do believe gold should be a part of your portfolio. I will trust my judgement to raise my portfolio bet in gold to 4% from 3% in my theoretical portfolio. (click to enlarge) Oil seems to be a hot topic today so I wouldn’t want to ignore it in my portfolio construction. While I cannot predict the future – I tend to bet that things “return to normalcy” over the long haul. Thus, my view is that oil will return to a pricing level around $75-$85. In the passive investing space, I am not making an actionable bet on the price action of oil. However, I do believe an opportunity exists for active investors who are diligent about researching quality businesses that are now discounted due to the fall in oil prices. One example I found was Schlumberger Limited (NYSE: SLB ). In another article , I discuss the benefits of individual selection in the oil and gas space. (click to enlarge) In my original portfolio, I made favorable S&P sector bets in the Utilities (NYSEARCA: XLU ) and Health Care (NYSEARCA: XLV ) sector ETFs. In the sector rotation model, it is clear that these two outperformed in the last year, signaling a potential business cycle decline. I do not live or die by sector rotation investing strategies; however, I do not think they should be ignored completely. I tend to look at the relative valuation of companies by sector and make my own judgments as to whether or not they are fairly valued. Interestingly, the financial sector does seem to be an unloved sector which could provide excess returns. Bill Nygren, a fund manager that I follow from Oakmark, is also overweight financials. With a belief that interest rates will rise, supporting sector rotation modeling, and the support of a successful value investing manager, I can remove the clouds and make a clear decision to shift my sector bet from Utilities to Financials (NYSEARCA: XLF ). I am holding onto Health Care because the long-term outlook remains positive. A close third would be the Technology sector (NYSEARCA: XLK ). In summary, I would sell my position in the high yield REIT ETF and use the sources to purchase SCHF to gain more international exposure. I would sell the Utilities sector ETF and purchase the Financials sector ETF with the proceeds. I would also sell a portion of my position in the Vanguard Short-Term Bond ETF (NYSEARCA: BSV ) and purchase additional amounts of the gold ETF until I reach the 4% of total portfolio allocation mark. Given the facts of today, I can only make what I feel is the best decision possible given a certain risk tolerance and investment objective. I hope you find this article useful as you too adjust your portfolio to the current market conditions. As always, best of luck in the new year!
Will Higher Physical Demand For Silver Drive Up SLV?

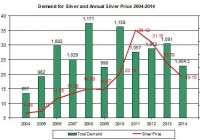
Summary The physical demand for silver has declined in 2014. Even if the demand were to pick up, the price of SLV may keep going down in 2015. The ratio of SLV to GLD gone up in 2014, which means SLV didn’t perform well compared to GLD. This year, the iShares Silver Trust ETF (NYSEARCA: SLV ) didn’t perform well as its price dropped by 18%. The low inflation, the FOMC’s change in policy and the drop in the price of gold contributed to the weakness of silver. Looking forward, even if the physical demand for silver were to pick up, it’s not likely to turn SLV back up. Let’s see why. Physical demand – does it matter? One of the main issues that bullion bulls point out is the changes in the demand for silver that could have an impact on the price of silver and SLV. But I think the changes in the physical demand played a secondary role on the price of SLV in recent years. The chart below presents the changes in demand for silver over the past decade and the average annual price of silver. Source of data Silver Institute and Reuters As you can see, the physical demand for silver seems to have limited impact on the price of SLV in the past few years especially. Back in 2008 the demand for silver reached its highest level in years, and SLV rose over $20, only to fall back by the end of the year to below $9 – so there was a reaction but it didn’t lead to staggering rise in SLV prices. Moreover, the spike in SLV prices during 2011-2012 doesn’t seem to relate to the changes in physical demand for the precious metal. During those years the demand didn’t increase compared to previous years. I also checked the changes in supply during those years — there was no a major shortage for silver on an annual scale more than in previous years. Conversely, even though the demand for silver grew in 2013, the price of SLV came down from its high levels of 2011-2012. Looking forward, HSBC still predicts higher demand for silver in 2015. This is why it retains its forecast price of silver at $17.65 per ounce. China, the world’s largest consumer of silver, will face economic challenges in 2015 – this could suggest China’s demand for silver may not increase any faster than it did in 2014. So the expected rise in physical demand may be harder to achieve next year. The other side of this equation is the changes in supply. In the past decade the supply, which mostly comes from mines, grew at a steady pace. This could change in 2015 as silver producers, which got use to the elevated price of silver over recent years, may taper down their output now that silver prices don’t provide a positive ROI for some of their mines. Such a shift, however, could take time to be reflected silver prices. And in any case, this is likely to be the secondary factor to impact SLV. The main issue is likely to be the changes in the demand for silver on paper, which is mostly driven by silver’s relation to gold, U.S. inflation expectations and treasuries yields. Let’s examine the first two. The issue related to treasuries yield you can see in this past post . This year, SLV has underperformed SPDR Gold Trust (NYSEARCA: GLD ). The relation between the two tended to be very strong and positive for the most part. Source of data: Google finance If GLD continues to remain flat or even slowly comes down, this likely to also bring down the price of SLV. The changes in U.S. inflation also tended to drive higher the price of SLV. The last time the U.S. inflation grew to over 10% was at beginning of the 1980. During that period, the price of silver spiked to around $48 for a very short time before it came back down along with the U.S. inflation. Back then, however, the story behind that spike and crash, which is known as Silver Thursday , was related to the Hunt bothers attempt to corner the silver market. But the rally of silver came even before the Hunt bothers tried to corner the market. Also, gold had a similar rise and fall in the early 80’s. The chart below presents the changes in U.S. core inflation (percent changes from a year back) and price of silver between 1978 and 1998. Source of data: FRED and Bloomberg In the past two decades, however, the U.S. inflation remained relatively flat – below 3%. But silver grew fast in 2011-2012. During those years, although the U.S. inflation remained low, the expectations for a sudden spike in inflation by bullion bulls were high. This is mainly due the FOMC’s policy of implementing its quantitative easing programs in low interest rates environment. Source of data: FRED and Bloomberg In the past few weeks the demand for SLV kept falling down: As of the end of last week, this ETF’s silver holdings have declined by 4% in the last two months. If the demand for silver for investment purposes continues to decrease, this is likely to bring down SLV. The potential fall in supply and expectations for a rise in physical demand may curb down the fall in SLV prices in 2015. But there are other factors that are likely to keep dragging down SLV: As the memories of the Fed’s QE programs remain in the rear view mirror, it becomes harder to see a sudden rise in inflation any time soon. Finally, if gold remains low and inflation doesn’t pick up, SLV isn’t likely to make a comeback in 2015.

GDX – The Way To Play Gold In 2015

Summary I anticipate gold will stabilize and turn higher during 2015. Over the near-term, the factors weighing against gold remain capable of hampering its price appreciation. I would avoid the risk inherent in owning individual miners, save for the most stable, and instead seek the leverage of the miners through GDX. Gold’s great fall of the past two years has been well-documented, and many experts see good enough reason for it to continue a while longer. However, I see the dynamics around the price of gold shifting. Given the greater swing lower of gold miners versus the price of gold, they may be priced right to benefit in a greater way from a turn in trend. Many of the miners are small and some are over-levered and vulnerable to further decline in the price of the commodity. So for the wherewithal to survive any further downswing while still availing capital to benefit from an upward move in gold, I suggest investors consider the Market Vectors Gold Miners ETF (NYSE: GDX ) here. I think that it’s one of the best ways to play for a turn in gold. Gold Past and Present I just published my expectations for gold in 2015 in a report formally marking my change in opinion about its direction. It is required reading for those studying this report, but I am summarizing it again here for those of you who might not get a chance to look at it. Then we can move forward to why I believe the Market Vectors Gold Miners ETF is a prime way to play gold in 2015. Gold prices came down significantly in 2013 and 2014, and gold relative securities followed. I believe it is popular opinion now that anticipation about the change in Federal Reserve monetary policy from expansionary to hawkish is what drove the start of the decline in gold prices in 2013. 2014 proved to be choppy for reasons discussed in my outlook report, but gold finally also found ultimate direction lower in 2014 as well. The key catalyst for that decline was the strengthening dollar, which anticipated and reacted to Fed action to halt quantitative easing. The dollar remains strong against relatively weaker currencies globally due to American economic strength and Fed monetary direction versus economic difficulties in Europe, Japan and elsewhere, and dovish central bank policy at the Bank of Japan (BOJ) and European Central Bank (ECB). To start 2015, and beginning already, I see capital flows out of better performing securities finding gold as investors seek to guard wealth again from the tides of tax relative flows. Before long, I expect a new question to be raised about the status of the dollar as a safe haven for wealth. Despite strong economic growth in the U.S. and relatively weaker activity overseas, I see geopolitical conflict somehow infecting our shores, and possibly our economy and currency in 2015. That risk alone already has sovereigns flirting with moves toward a gold standard. Some are making the change out of necessity, like Russia and Iran, but others will do so out of preference. I see this as a prelude to a future trend. The key catalyst for the dollar is likely tiring at this point. I believe the dollar has already greatly priced in the start of Fed rate hikes coming in 2015. So, a sell the news type of scenario could play out with the dollar shedding value and gold and other commodities seeing renewed price strength in 2015, especially if the dollar’s safe haven status is placed into question as I expect. Please read my report for more detail on my view for gold. Gold Miners Decline and Position Gold Relative Securities YTD SPDR Gold Trust ETF (NYSE: GLD ) -4.4% iShares Silver Trust ETF (NYSE: SLV ) -19.4% Market Vectors Gold Miners -15.4% Goldcorp (NYSE: GG ) -17.9% Newmont Mining (NYSE: NEM ) -21.7% Barrick Gold (NYSE: ABX ) -42.3% Kinross Gold (NYSE: KGC ) -39.7% Randgold Resources (NASDAQ: GOLD ) +0.4% Yamana Gold (NYSE: AUY ) -55.4% You can see how gold miners have exaggerated the price decline of gold in the comparison of the miners’ performance to the SPDR Gold Trust ETF, which tracks the price of gold. The miners are off by a significantly greater margin this year-to-date; the miner-encompassing Market Vectors Gold Miners ETF is down 15.4% versus the 4.4% slide in the GLD this year. However, the declines of most of the individual gold miners’ shares have been far greater. Even the industry leaders are off by a greater margin than the GDX. This illustrates how levered the gold miners are to the price of gold, both individually and as a group, but it also shows how risk can be reduced by using the GDX versus individual miners. Why GDX Over Miners Yamana Gold is down more than 55% this year, versus the 15.4% drop of the GDX. That’s because Yamana has 29X more debt than equity, and threshold where it becomes unfeasible for it to produce gold. It’s thereby vulnerable to swings in the price of gold and bears company specific liquidity and solvency risk. This would be the case across a swath of miners, and individual exploration and production results could disappoint as well. However the Market Vectors Gold Miners ETF allows the investor to eliminate company specific risk, or at least minimize it. The ETF seeks to match the performance of the NYSE Arca Gold Miners Index. While the GDX may hold the shares of small cap miners, its holdings are part of a diversified portfolio of firms within the mining industry. Therefore, if one miner goes bankrupt or produces poor results, the GDX will not see much price impact. It allows investors to bet on the leverage inherent in gold miners to the price of gold but to reduce the risk that exists in holding one company. Similarly to the year-to-date performance shown in the table above, the five-year charts of the GLD and the GDX show that gold miners have exaggerated the move downward in gold. I believe this reflects a sort of inverse bubble in the miners, where downside has been overdone and the shares are oversold. If we were to put the two charts together, we would see that a wide gap has opened between the struggling GDX and the valuation of the GLD. I expect it to close that gap once gold prices begin a sustainable move higher. Given my view that gold prices will stabilize and begin to move higher in the coming year, I favor long-term investment in gold relative securities. As there remain risks to the price of gold, I would refrain from investment in individual gold miners due to company specific risks, save for the largest and most stable of the firms. Instead, I suggest the Market Vectors Gold Miners security as the way to best lever the turn in gold I see, without bearing the risks inherent to individual miners.