Tag Archives: nysearcagld

State Of Disunion: Safer Haven Investments Diverge From Stocks

The appetite for risk has been changing before our eyes. Large-cap U.S. stocks in the S&P 500 still rocketed mightily. Safer haven assets were every bit as desirable as the Dow and the S&P 500 in 2014. Is that uncommon for a late-stage bull market? Not particularly. On the other hand, the landscape may be changing. The S&P 500 soared 29.6% and 11.4% in 2013 and 2014 respectively, pushing the broad market benchmark to unimaginable heights. Net inflows into U.S. stock funds, including ETFs, also set records. Unfortunately, that is not always a positive sign for the asset class. The increased participation by the world’s investors in U.S. stocks may not be inordinately alarming. What might be far more ominous? The remarkable performance of safer haven assets over “stuck-in-place” stock assets since the Federal Reserve ended its third round of quantitative easing (QE3) on October 31. Specifically, the 30-year treasury yield has plummeted from roughly 3.0% to 2.4%, sending a proxy like the PIMCO 25+ Year Zero Coupon U.S. Treasury Index ETF (NYSEARCA: ZROZ ) up more than 20%. Similarly, the iShares 20+ Year Treasury Bond ETF (NYSEARCA: TLT ) has pocketed nearly 14%, while the SPDR Gold Trust ETF (NYSEARCA: GLD ) has rallied about 10%. The appetite for risk has been changing before our eyes. Remember the success of riskier equities in 2013, as investors ran from treasury bonds and gold? Indeed, 2013 was only one of two negative years for total bond returns across two decades. Equally staggering, gold appeared to many as if it might collapse altogether. The nature of risk shifted in 2014. Large-cap U.S. stocks in the S&P 500 still rocketed mightily. Yet the clear preference of stocks over safer holdings evaporated; treasuries rallied throughout the year, in spite of the near-unanimous sentiment that interest rates would fall. (Note: I am not opposed to tooting my own horn on this one – I recommended pairing large-cap stock ETFs with long duration treasury ETFs like the Vanguard Extended Duration Treasury ETF (NYSEARCA: EDV ) and ZROZ 13 months earlier.) Safer haven assets were every bit as desirable as the Dow and the S&P 500 in 2014. Some of them like TLT and ZROZ were more desirable. At least for a calendar round-trip, the ownership of historically divergent asset classes produced harmony and indivisibility. Is that uncommon for a late-stage bull market? Not particularly. On the other hand, the landscape may be changing. The perceived need for safety has risen appreciably since the Federal Reserve ended its electronic money printing in October. For example, in 2015, each of the 10 components of the FTSE Custom Multi-Asset Stock Hedge Index has gained ground, whereas the S&P 500 has drifted lower. Those component assets include long-maturity treasuries, zero-coupon bonds, munis, inflation-protected securities, German bunds, Japanese government bonds, gold, the Swiss franc, the yen and the dollar. Granted, the European Central Bank (ECB) intention to create $50 billion euros monthly for a year could reward risk-taking in the same manner that the Federal Reserve’s $85 billion per month had. On the flip side, the $600 billion euro figure that is floating on newswires may come off as underwhelming, as the Fed’s QE3 had been open-ended upon its announcement. Moreover, the “stimulus” amount ran beyond the trillion-and-a-half level. Keep in mind, you do not need to run from stock risk if you have a plan to minimize the severe capital depreciation associated with bear markets. My approach in latter stage bull markets involves pairing lower volatility stock ETFs like the iShares MSCI USA Minimum Volatility ETF (NYSEARCA: USMV ) and the iShares S&P 100 ETF (NYSEARCA: OEF ) with safer haven ETFs like the Vanguard Long-Term Bond ETF (NYSEARCA: BLV ) and EDV. If popular stock benchmarks breach 200-day trendlines, I reduce equity exposure and/or employ multi-asset stock hedging by investing in those assets with a history of performing well in moderate-to-severe stock downturns. Click here for Gary’s latest podcast. Disclosure: Gary Gordon, MS, CFP is the president of Pacific Park Financial, Inc., a Registered Investment Adviser with the SEC. Gary Gordon, Pacific Park Financial, Inc, and/or its clients may hold positions in the ETFs, mutual funds, and/or any investment asset mentioned above. The commentary does not constitute individualized investment advice. The opinions offered herein are not personalized recommendations to buy, sell or hold securities. At times, issuers of exchange-traded products compensate Pacific Park Financial, Inc. or its subsidiaries for advertising at the ETF Expert web site. ETF Expert content is created independently of any advertising relationships.
The SNB Catalyst For GLD

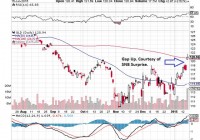
Summary SNB surprised the market by its sudden decision to abandon the EURCHF floor and reduce its deposit rate further to -0.75%. Existing push factor of GLD such as current deflation, strong USD and holding cost is being pushed aside by negative interest rates and market concern about market stability. Global negative interest interest rates is attracting bids for GLD especially when conservative investors cannot hold their funds in safe deposit and bonds without attracting a penalty. Deeper market concerns over the ability to grow the economies of Europe and Japan without destabilizing the economic system. SNB Surprise served as a catalyst to bring these concerns to the front of investors mind and is responsible for the gap up of GLD. The Swiss National Bank (SNB) surprised the market on 15 January 2015 by announcing the abandonment of the floor of the Swiss Franc (CHF) 1.20 to the euro. In addition, the SNB announced that it has reduced its sight deposit rate from -0.25% to -0.75%, effective 22 January 2015. The rationale that the SNB imposed this floor in 2012 is to prevent importing deflation from Europe but it has done it at the cost of a ballooning balance sheet to GDP from at least 60% to 85%. The SNB has finally accepted that deflation of -0.1% for this year and have made it clear that even if they do prevent deflation from Europe, they can’t prevent deflation from the U.S. through a strengthening USD. In this article, we will look at how the conflicting pull and push factors which affect the attractiveness of gold. In my previous articles, I have been bearish on gold as I consider opportunity cost of holding gold when the U.S. economy is rising and the fact that the strengthening USD will weaken gold. In addition, I have considered the fact that there is very little inflation worldwide given the low energy price. Hence gold would lose its allure as an inflation hedge, especially when it is increasingly clear that major economies like Japan and Europe is nearer to deflation than inflation. Negative Interest Rates Even as I consider these factors to be relevant, it would appear that other factors are now raising to the forefront to challenge these push factors of gold. The most prominent factor would have to be the negative interest rates. We are seeing a number of major countries imposing negative interest rates. The latest and deepest negative interest rates come from the SNB at -0.75% of deposit rates. The European Central Bank (ECB) has set its deposit rate to -0.1% and there are Japanese Treasury Bills that are having negative interest rates . This is because investors prefer these treasury bills even when key interest rates are zero and they are willing to pay a premium for it. Negative interest rate means that investors have to pay the banks to keep their money and this has offset the cost of gold purchase. For investors who are conservative, they are not likely to invest into equities which they perceive to be of high risk. Given that they can’t deposit their money safely in banks or bonds without attracting a penalty, they are more likely to be attracted to gold as a store of value. Market Concern about Economic Stability Then there is the risk of unintended consequences. With the ECB and Bank of Japan (BoJ) determined to ease monetary conditions further, they are increasing the risk that these actions will cause a bubble in the future. The issue is that inflation might surface in other form with all these QE efforts. These QE measures are described as emergency measures by the Fed and this is why they are being rolled back by the Fed right now. The question remains unanswered in the market as to whether a prolonged dosage of QE will actually help or harm the economy. We have to remember that the Fed used QE to purchase banks asset to restore confidence in the system and this is done with a bank stress test. The banks subsequently healed as investor confidence were restored and were able to lend as they have a clean balance sheet. They also have incentive to lend as the economy recovers amid a low interest rates environment. As the economy recovers, people consumes and we naturally see inflation which stands at 1.3% in December 2014. This will have been higher if not for low energy prices. There might be a question as to whether the banks started to lend first or the economy recovered and people consumed first before the banks were willing to lend. My opinion is that QE and the bank stress test cause the recovery in confidence first and the bank lending and consumption happened in tandem. The big question for Europe and Japan is that despite all these efforts in QE, we do not see a recovery in their economy. Europe is still having sub 1% growth and Japan has slipped into recession again with the second and third quarter of contraction in 2014. This might point to a bigger problem to their economies than what QE can solve. SNB Catalyst on GLD The SNB move to abandon the peg and lessen the deposit rate serves as a catalyst which brought the issue of negative interest rates to the forefront of investor’s mind. This is a signal to investors that there might be a paradigm shift in how major economies will operate from now on. The fact that the SNB has to surprise the market instead of following the usual central bank communications strategy which has been the norm for the past 10 years also hints at future uncertainty. In this environment, we are likely to see more demand from gold. We can see this from the SPDR Gold Trust ETF (NYSEARCA: GLD ) chart below. GLD tracks the performance of gold bullion after expenses and it is listed on the New York Stock Exchange. It is liquid with $27.54 billion of market capitalization and 17 million of last known daily transactions. (click to enlarge) Despite this liquidity, we see that GLD gap up on the SNB surprise. This is a clear sign that there are issues in the Europe and Japan which the market is concerned about. The market’s concern seems to be that despite the QEs, Japan and Europe would not be able to solve their issues. The side effect of these QE besides the massive purchase of securities, is to resort to negative interest rates which is forcing conservative investors out of safe deposit. These issues have always come along with QE and the market assumption has been that the recovery prospect will outweigh the risk involved as mentioned above. However the SNB surprise suggest otherwise and this is serving as a catalyst for these issues to surface and for GLD to gap up. Of course, the market has been wrong before and GLD was up from 2009 when the Fed started its first QE to 2011 when it was clear that the U.S. economy has recovered before GLD became bearish again. There is a possibility that this will be the start of a new bullish trend for the medium term if Europe and Japan is not able to get their act together. It would appear that even the strong USD cannot hold down GLD and this shows the depth of the market concerns.

Investors Still Betting On Oil ETFs

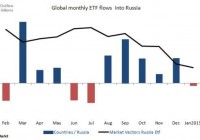
Summary Russian ETF inflows continued to add exposure to the country in 2014, but first signs of outflows in 2015. Oil ETFs have seen net inflows of $1.3bn so far this year. Investors have pulled $80bn from gold ETFs since 2012. Collapsing oil prices and the free falling Russian market have so far not tested the patience of ETF investors, who continued to double down on these loss-making trades in 2014; a stark contrast to 2013’s gold slump when ETF investors rushed to the door. ETF investors’ Russian affair Russian exposed ETFs saw consistent inflows of $1.5bn in the last five months of 2014 as the Russian market continued to decline with sanctions, declining oil prices and the devaluing rouble hitting the market. However, while these inflows were occurring, the largest Russian exposed ETF, the Market Vectors Russian ETF (NYSEARCA: RSX ), saw its price decrease by over a third from August to December 2014. This trend looks to be reversing somewhat in the New Year, as Russian exposed ETFs are on track for their first monthly outflows in six months, as investors’ resilience and staying power may have begun to wane. Chasing oil’s bottom Oil prices have slid by 50% since mid-June 2014 and the largest Oil ETF, the United States Oil Fund (NYSEARCA: USO ) with AUM of $1.7bn, is down by a parallel 54% over the same time period. ETF investors are continuing to ‘double down’ after catching knives over the past four months while oil prices continued to decline. Prices are currently hovering at $46 per barrel (Brent). Investors’ faith in an oil price recovery seems to have increased, as fund flows into oil exposed ETFs look set to beat December’s total inflows of $1.7bn, with inflows so far this month already standing at $1.3bn. Interestingly, oil was at similar price level back in 2009, when we also saw strong inflows into oil ETFs after a dramatic collapse in global oil prices. ETF investors could see more red in the short term though, as news out this week reveals record oil imports for China hitting highs of 7m barrels per day. These have been cited as being destined for strategic and commercial reserves. Turning against gold Gold has not been so precious in the eyes of ETF investors, as ETFs exposed to the metal’s price movements have continued to see sustained outflows over the last two years. The last two years has seen only four months of net inflows. This comes as the commodity declined from 2011 highs of ~$1800, stabilising at $1259 currently. The end of quantitative easing in the US and an expectation of a strengthening dollar and weaker global demand has seen the precious metal fall out of favour with investors. The largest gold ETF, the SPDR Gold shares ETF (NYSEARCA: GLD ) has $28bn AUM which represents 44% of total AUM exposed to the metal. This AUM figure has fallen by over 60% from the $72bn it managed at start of January 2013.