Tag Archives: nysearcagld

The Permanent Portfolio Is Dead

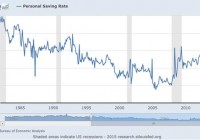
Summary Permanent Portfolio has underperformed U.S. stocks, and several stock/bond allocations, since 2012. Gold has delivered most of Permanent Portfolio’s gains since 2007; as gold underperformed since 2012, so has the Permanent Portfolio. Permanent Portfolio worked in an age of booming credit-based consumption, but does not work in an age of secular stagnation. Even if we aren’t in an age of secular stagnation, the permanent portfolio’s three-year underperformance indicates that it is no longer permanent, and is best avoided. If you’ve never heard of the permanent portfolio, consider yourself lucky. If you have heard of it, I’m sorry to tell you this: it’s not permanent anymore. Which means it really never was. That doesn’t mean it had a great run, but the run is over and it’s time to move on. What is the Permanent Portfolio? The permanent portfolio was first designed by investment analyst and libertarian politician Harry Browne, who called it a “fail-safe” investment. The idea was simple enough to appear elegant: a portfolio of equal weightings of four asset classes: * 25% U.S. stocks-e.g., the SPDR S&P 500 Trust (NYSEARCA: SPY ) or Vanguard Total Stock Market ETF (NYSEARCA: VTI ) * 25% long-term Treasury bonds-e.g., the iShares Barclays 20+ Year Treasury Bond Fund (NYSEARCA: TLT ) * 25% cash-e.g. the Short Treasury Bond ETF (NYSEARCA: SHV ), or just cash * 25% precious metals (specifically, gold)-e.g. the SPDR Gold Trust ETF (NYSEARCA: GLD ) The stocks were for times of prosperity. The bonds were for times of deflation, the cash was for times of recession, and the gold was for times of inflation. An equal weighting of all of these, the theory went, would protect an investor from any one scenario and outperform a focus on any one asset class. Harry Browne dreamed up the permanent portfolio in 1982 when rampant inflation was eating into everyone’s purchasing power and stagnant economic growth was crimping most people’s ability to earn and save. Shortly after Browne’s vision, the U.S. gave up its steady savings rate and learned to love credit cards, causing the national savings rate to plummet: (click to enlarge) The 1980s were a time of high inflation and strong stock growth, providing tailwinds for Browne’s brainchild. Those who followed Browne’s lead had market-beating returns and shockingly little volatility. According to Crawlingroad.com , the permanent portfolio had a 11.5% average return from 1982 to 1990, and no negative years (it did however have a negative return in 1981 due to a 32.9% drop in gold). Backtesting the strategy, we see only three years of negative returns since 1971: Even more impressively, the permanent portfolio managed a positive return even in years when two asset classes had horrible years, like in 1973 when stocks and bonds fell, or 2000 when stocks and gold both fell. Performance Since 2008 This was part of the PP appeal back in 2011 and 2012. The memory of the 2008-2009 crash was fresh in everyone’s minds. Real estate seemed toxic and gold was soaring. Income was getting harder to find, and everything seemed too risky. A lot of people wanted to invest, but were still terrified of the stock market. Low volatility and diversification were hot topics, and this made the Browne’s permanent portfolio come back into vogue: (click to enlarge) The chart above tracks Google searches for “permanent portfolio”, and the steady rise in 2010 to 2012, to breach spikes in searches during the 2008 crisis, is partly an indicator of just how enduring Browne’s idea is in times of fear. Those who searched back then were probably pleased with what they saw. The permanent portfolio steadily provided strong returns throughout the 90s and 2000s, and even seemed to weather the storm of 2008 , when talk of apocalypse graced the lips of the financial press: (click to enlarge) It’s no surprise, then, that many turned to the permanent portfolio, which had held steady returns largely thanks to gold and U.S. Treasuries during and immediately after the crash. Of course past performance is no indicator of future results, and those who have stayed with Browne have had some stressful times since then. The portfolio has massively underperformed stocks since 2012, and has actually lost about 15% from then to the present. To make matters even worse, Morningstar rates the Permanent Portfolio Fund (MUTF: PRPFX ) one star for its 3-year and 5-year returns, with low returns and high risk. Yet its 10-year rating is high return and above average risk with four stars. Clearly something changed in the last three years to obliterate Browne’s strategy. So what happened? Why Permanent Portfolio Doesn’t Work Anymore A quick glance at one chart shows the problem. Taking together an ETF portfolio following the PP philosophy, our basket will contain SHV, GLD, TLT, and SPY in equal amounts. Looking at these funds’ performance since 2007 tells us one thing: gold is the biggest contributor to our returns: (click to enlarge) Gold rose over 180% from start to peak, and has erased over 100 percentage points of gains since then. The fall has decelerated in recent months, but the slide in gold’s value has hit our PP severely, while both TLT and SPY provide us with much smaller, but much steadier returns since 2009. Why is gold underperforming? The primary reason is simple: a lack of inflation. If we look at the urban consumer price index (CPI-U) and the personal consumption expenditure index (PCE), which are the two biggest indices for measuring inflation used by economists both in and outside the Federal Reserve, we see an average annual inflation rate of 1.81% since 2007–far below the historic norm and below the Federal Reserve’s target: (click to enlarge) As Browne told us, low inflation means underperformance for gold. If we are in an era of secular stagnation, as Professor Larry Summers confidently tells us , then it is unlikely that we will see inflation rates rise considerably beyond that. But we also won’t necessarily see broad prosperity either, which should put pressure on stocks if quantitative easing and low yields do not drive more money into the stock market. Thus two of the four major components of the permanent portfolio are likely to drag down returns. If you disagree with Larry Summers, as Ben Bernanke famously did in a recent series of blog posts , that doesn’t mean you will necessarily benefit from the permanent portfolio either. The fact that the PP has underperformed in the last three years, providing YTD returns of -1.5%, 1 year returns of -7.6%, and 3-year annualized returns of 0.5%, tells us that the permanent portfolio is no longer permanent. It also tells us that something fundamental has changed in the world since 1982, and last generation’s sound investment advice is folly for this generation. Don’t Invest Your Politics One of Browne’s biggest appeals is his libertarian character. A former libertarian presidential nominee, the late Harry Browne wrote several books about the failure of government, the importance of self-reliance, and the importance of freedom (his most popular book is titled “How I Found Freedom in an Unfree World”). I suspect many permanent portfolio investors are likewise libertarians, who find sense in Browne’s message and thus think that will somehow translate to market-beating returns. The guilt by association fallacy here has been a costly one for investors over the last three years. Libertarian or no, investors who understand that politics and markets are separate things that may sometimes intersect have been able to avoid the allure of a permanent portfolio, and move their strategy with the market. Those who did so in 2012 and saw value in equities have beaten the Permanent Portfolio. So did those who bought high yield bonds, or those who went into real estate. Even those who bought U.S. Treasuries have done better than Browne’s followers. It is clear that the Permanent Portfolio is not so permanent anymore. For those looking for low volatility and steady appreciation, it is time to look elsewhere. Disclosure: I/we have no positions in any stocks mentioned, and no plans to initiate any positions within the next 72 hours. (More…) I wrote this article myself, and it expresses my own opinions. I am not receiving compensation for it (other than from Seeking Alpha). I have no business relationship with any company whose stock is mentioned in this article.
ETFReplay.com July Update

Independent research, long/short equity, dividend investing, ETF investing “}); $$(‘#article_top_info .info_content div’)[0].insert({bottom: $(‘mover’)}); } $(‘article_top_info’).addClassName(test_version); } SeekingAlpha.Initializer.onDOMLoad(function(){ setEvents();}); The ETFReplay.com Portfolio holdings have been updated for July 2015. I previously detailed here and here how an investor can use ETFReplay.com to screen for best performing ETFs based on momentum and volatility. The portfolio begins with a static basket of 14 ETFs. These 14 ETFs are ranked by 6 month total returns (weighted 40%), 3 month total returns (weighted 30%), and 3 month price volatility (weighted 30%). The top 4 are purchased at the beginning of each month. When a holding drops out of the top 5 ETFs it will be sold and replaced with the next highest ranked ETF. The 14 ETFs are listed below: Symbol Name RWX SPDR Dow Jones International Real Estate ETF PCY PowerShares Emerging Markets Sovereign Debt Portfolio ETF WIP SPDR DB International Government Inflation-Protected Bond ETF EFA iShares MSCI EAFE ETF HYG iShares iBoxx $ High Yield Corporate Bond ETF EEM i Shares MSCI Emerging Markets ETF LQD iShares iBoxx $ Investment Grade Corporate Bond ETF VNQ Vanguard REIT Index ETF TIP iShares TIPS Bond ETF VTI Vanguard Total Stock Market ETF DBC PowerShares DB Commodity Index Tracking ETF GLD SPDR Gold Trust ETF TLT iShares 20+ Year Treasury Bond ETF SHY iShares 1-3 Year Treasury Bond ETF In addition, ETFs must be ranked above the cash-like ETF ((NYSEARCA: SHY )) in order to be included in the portfolio, similar to the absolute momentum strategy I profiled here . This modification could help reduce drawdowns during periods of high volatility and/or negative market conditions (see 2008-2009), but it could also reduce total returns by allocating to cash in lieu of an asset class. The cash filter is in effect this month. SHY is the highest rated ETF in the 6/3/3 system. Therefore, all current holdings will be sold and the proceeds used to purchase SHY. The top 5 ranked ETFs based on the 6/3/3 system as of 6/30/15 are below: 6mo/3mo/3mo SHY iShares 1-3 Year Treasury Bond ETF EFA iShares MSCI EAFE ETF HYG iShares iBoxx $ High Yield Corporate Bond ETF PCY PowerShares Emerging Markets Sovereign Debt Portfolio ETF VTI Vanguard Total Stock Market ETF In 2014 I introduced a pure momentum system, which ranks the same basket of 14 ETFs based solely on 6 month price momentum. There is no cash filter in the pure momentum system, volatility ranking, or requirement to limit turnover – the top 4 ETFs based on price momentum are purchased each month. The portfolio and rankings are posted on the same spreadsheet as the 6/3/3 strategy. The top 4 six month momentum ETFs are below: 6 month Momentum EFA iShares MSCI EAFE ETF EEM i Shares MSCI Emerging Markets ETF RWX SPDR Dow Jones International Real Estate ETF HYG iShares iBoxx $ High Yield Corporate Bond ETF VTI, a holding since September 2014 will be sold for a 5%+ gain and replaced by EEM. TLT, a holding since September 2014 will be sold for a 1%+ gain and replaced by HYG. The updated holdings for each portfolio are below. 6/3/3 strategy: Position Shares Avg Purchase Price Purchase Date Cost Basis Current Value Gain/Loss Excluding Dividends Percentage Gain/Loss Excluding Dividends SHY 149 84.86 5/29/2015 & 6/30/15 $12,644.14 $12,644.14 $0.00 0.00% Pure Momentum strategy: Current Positions Position Shares Purchase Price Purchase Date Cost Basis Current Value Gain/Loss Excluding Dividends Percentage Gain/Loss Excluding Dividends EEM 60 39.62 6/30/2015 $2,377.20 $2,377.20 $0.00 0.00% RWX 64 43.99 4/2/2015 $2,815.36 $2,679.04 -$136.32 -4.84% HYG 27 88.8 6/30/2015 $2,397.60 $2,397.60 $0.00 0.00% EFA 39 66.51 4/30/2015 $2,593.89 $2,476.11 -$117.78 -4.54% Disclosures: None Share this article with a colleague

The Labor Market Could Bring Down GLD

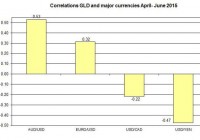
Summary The Greek drama keeps moving the markets and the price of GLD also reacts mainly via the movements in the foreign exchange markets. The price of GLD is likely to keep reacting to the progress of the U.S. economy. The non-farm payroll report could move again the price of GLD and raise the odds of a rate hike in September. The Greek drama continues to lead the news cycle and keeps to move the euro against major currencies including the U.S. dollar. The strengthening of the U.S. dollar against the euro could have an adverse impact on the price of the SPDR Gold Trust ETF (NYSEARCA: GLD ). Besides the ongoing bets of whether Greece exits the Eurozone, this week we also have the release of the non-farm payroll report. This report is likely to keep moving the gold market in general and GLD, as the markets try to figure whether the current economic conditions are good enough for the Federal Reserve to raise rates in September. The decision of Alexis Tsipras to call for a referendum is understandable given the high stakes involved, but should have been made a while back, and not so close to the IMF’s payment deadline. For now, the polls suggest the Greeks are likely to accept this deal. Because they are more frightened of what lies ahead with a Grexit over remaining in the Eurozone or in other words better the devil you know… Behind door number one, in the event of a Grexit, the Greeks could face very weak currency, high inflation, unstable, if at all, banking system for years to come. But door number two isn’t too appealing either: elevated unemployment, much higher taxes, lower pensions, and high debt payments for decades. At least under this status quo option, they keep having a strong currency and a working baking system. Who would want to make this lesser of two evils choice? When it comes to the potential impact of the news about a Greek exit or default on its debt on the euro, the situation isn’t straight forward. For one, investors and traders react to the uncertainty following a messy Greek exit with falling stock prices throughout Europe, Asia and U.S. and falling euro against leading currencies. But over the longer run, such a scenario should move the euro upward as part of the weakness of this currency relates to the high debt European countries including Greece. One fewer highly leveraged country in the EU should lead, down the line, to an appreciation of the euro. For GLD, even though higher uncertainty in the financial markets tends to play in favor of precious metals, the potential appreciation of the U.S. dollar against the euro could drag down the price of GLD. (click to enlarge) Source of data: Author’s calculations The other big news item for the week is the non-farm payroll report. This week, the report will be released on Thursday and could move the price of GLD as it has in the past. Last month, the employment report showed a 280,000 gain in number of jobs, which was higher than expected. This time, the market estimates a gain of 231,000 jobs. If the report were to show a higher increase in number of jobs, this could lead to another drop in the price of GLD. (click to enlarge) Source of data: U.S. Bureau of Labor Statistics and Google Finance Besides the short-term impact of the news of the progress of the U.S. labor market, this news could also raise the odds, which have gone down after the last FOMC meeting, of a rate hike in September. Another issue to keep tabs on is the changes in wages, which have gone up slowly in the past few months – the growth rate reached 2.3% last month. A higher growth rate could also raise the odds of a potential rate hike – it’s another closely monitored data point in the labor report, and so far this year, we have only seen a modest increase in wages. As of the beginning of this week, the implied probabilities for a rate hike in September have reached 14%; for the October meeting, the odds are 28%; and for December, the probabilities are only 50%. These odds still suggest the market isn’t convinced the FOMC plans to raise rates in September. The upcoming non-farm payroll report could have another short-term impact on the price of GLD and move the odds of the possible rate hike in the coming months. The minutes of the last FOMC meeting will be released next week, but aren’t likely to provide more guidance than the last FOMC meeting. So far, the Fed keeps using the same mantra – the decision to raise rates will be “data dependent” – and as such, we will have to continue to closely monitor the progress of the U.S. economy. For more, please see: ” Gold and Inflation – Is there is relation? ” Disclosure: I/we have no positions in any stocks mentioned, and no plans to initiate any positions within the next 72 hours. (More…) I wrote this article myself, and it expresses my own opinions. I am not receiving compensation for it (other than from Seeking Alpha). I have no business relationship with any company whose stock is mentioned in this article.